|
||
|
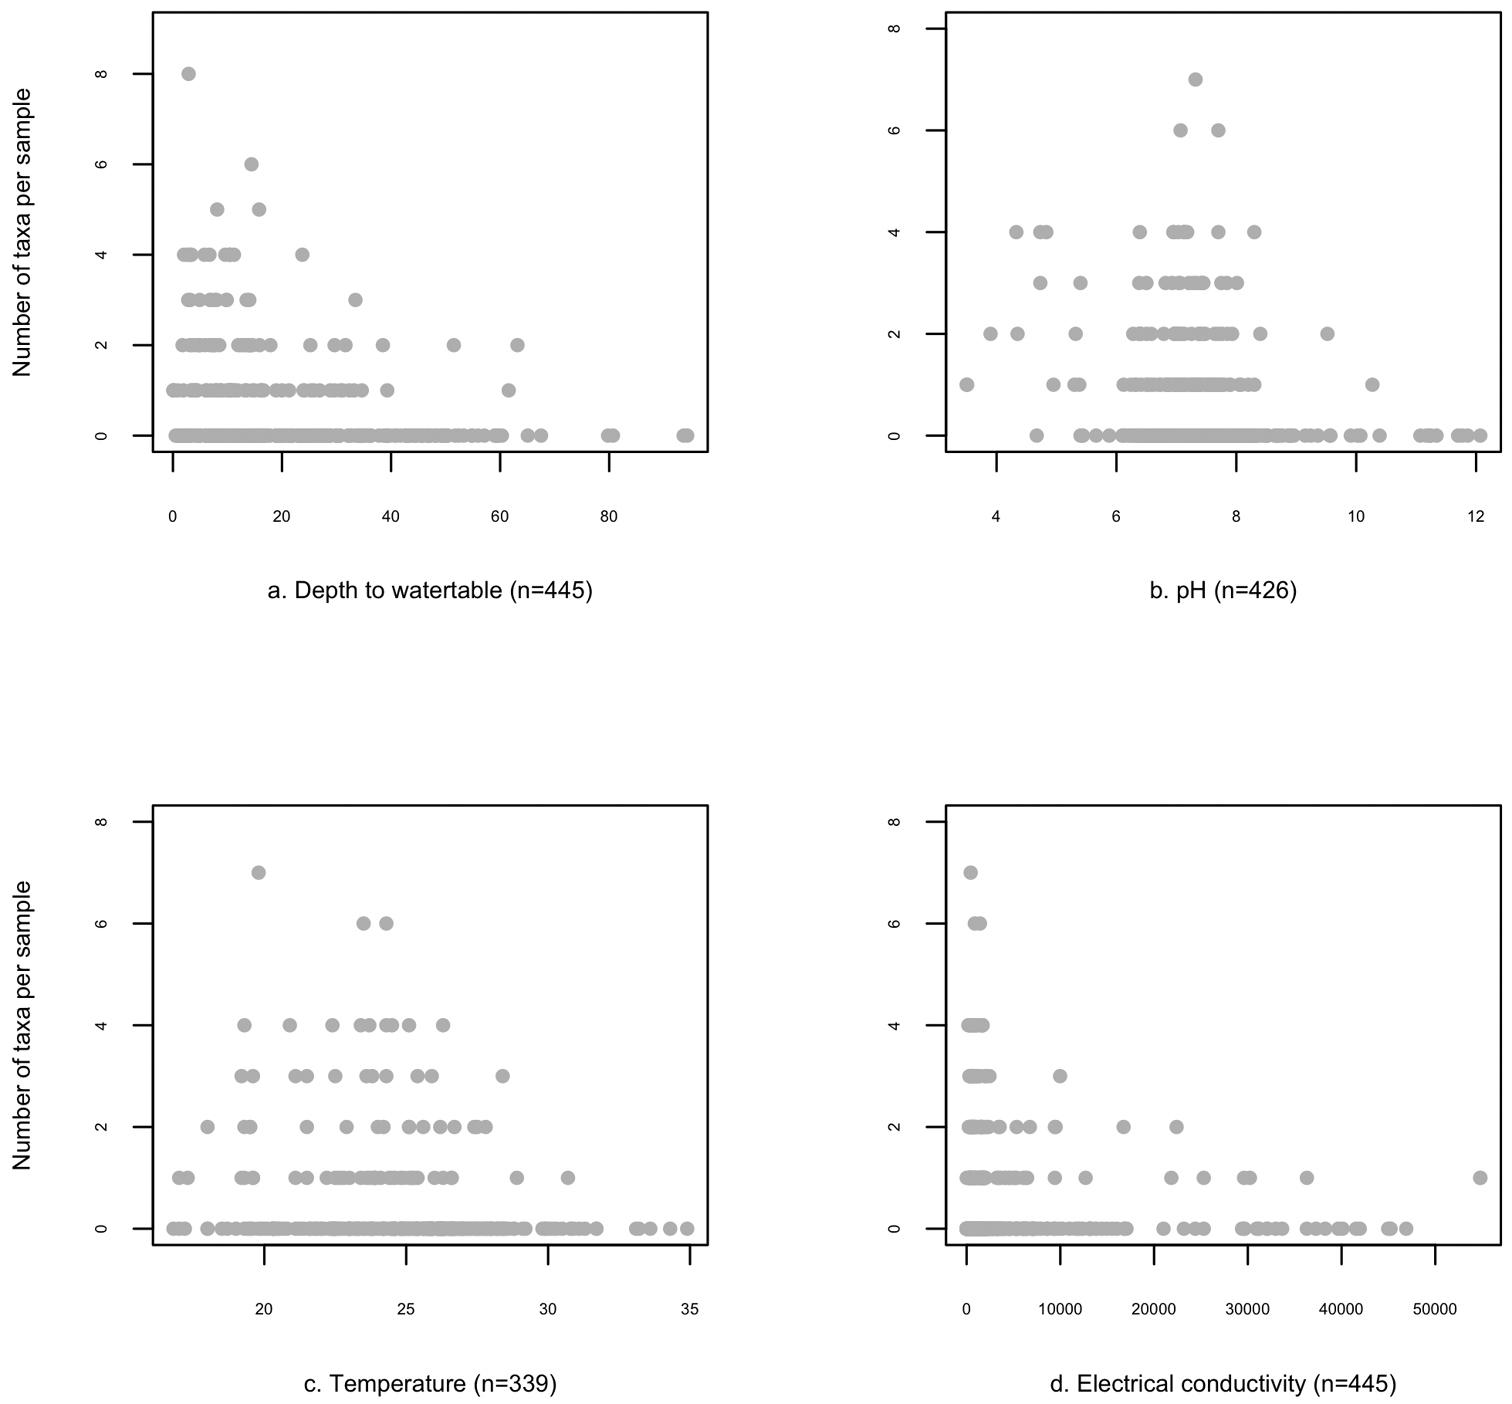
Scatterplots showing the relationship between stygofauna taxon richness per sample and different physico-chemical variables; In Figure 10 the scatterplots presented are based on available data in the Queensland Subterranean Aquatic Fauna database where: depth to groundwater is available for 113 samples in meters below ground level (mbgl); electrical conductivity is available for 137 samples in microSiemens per centimetre (μS/cm); pH is available for 130 samples; and temperature is available for 77 samples in degrees Celsius (°C). |