|
||
|
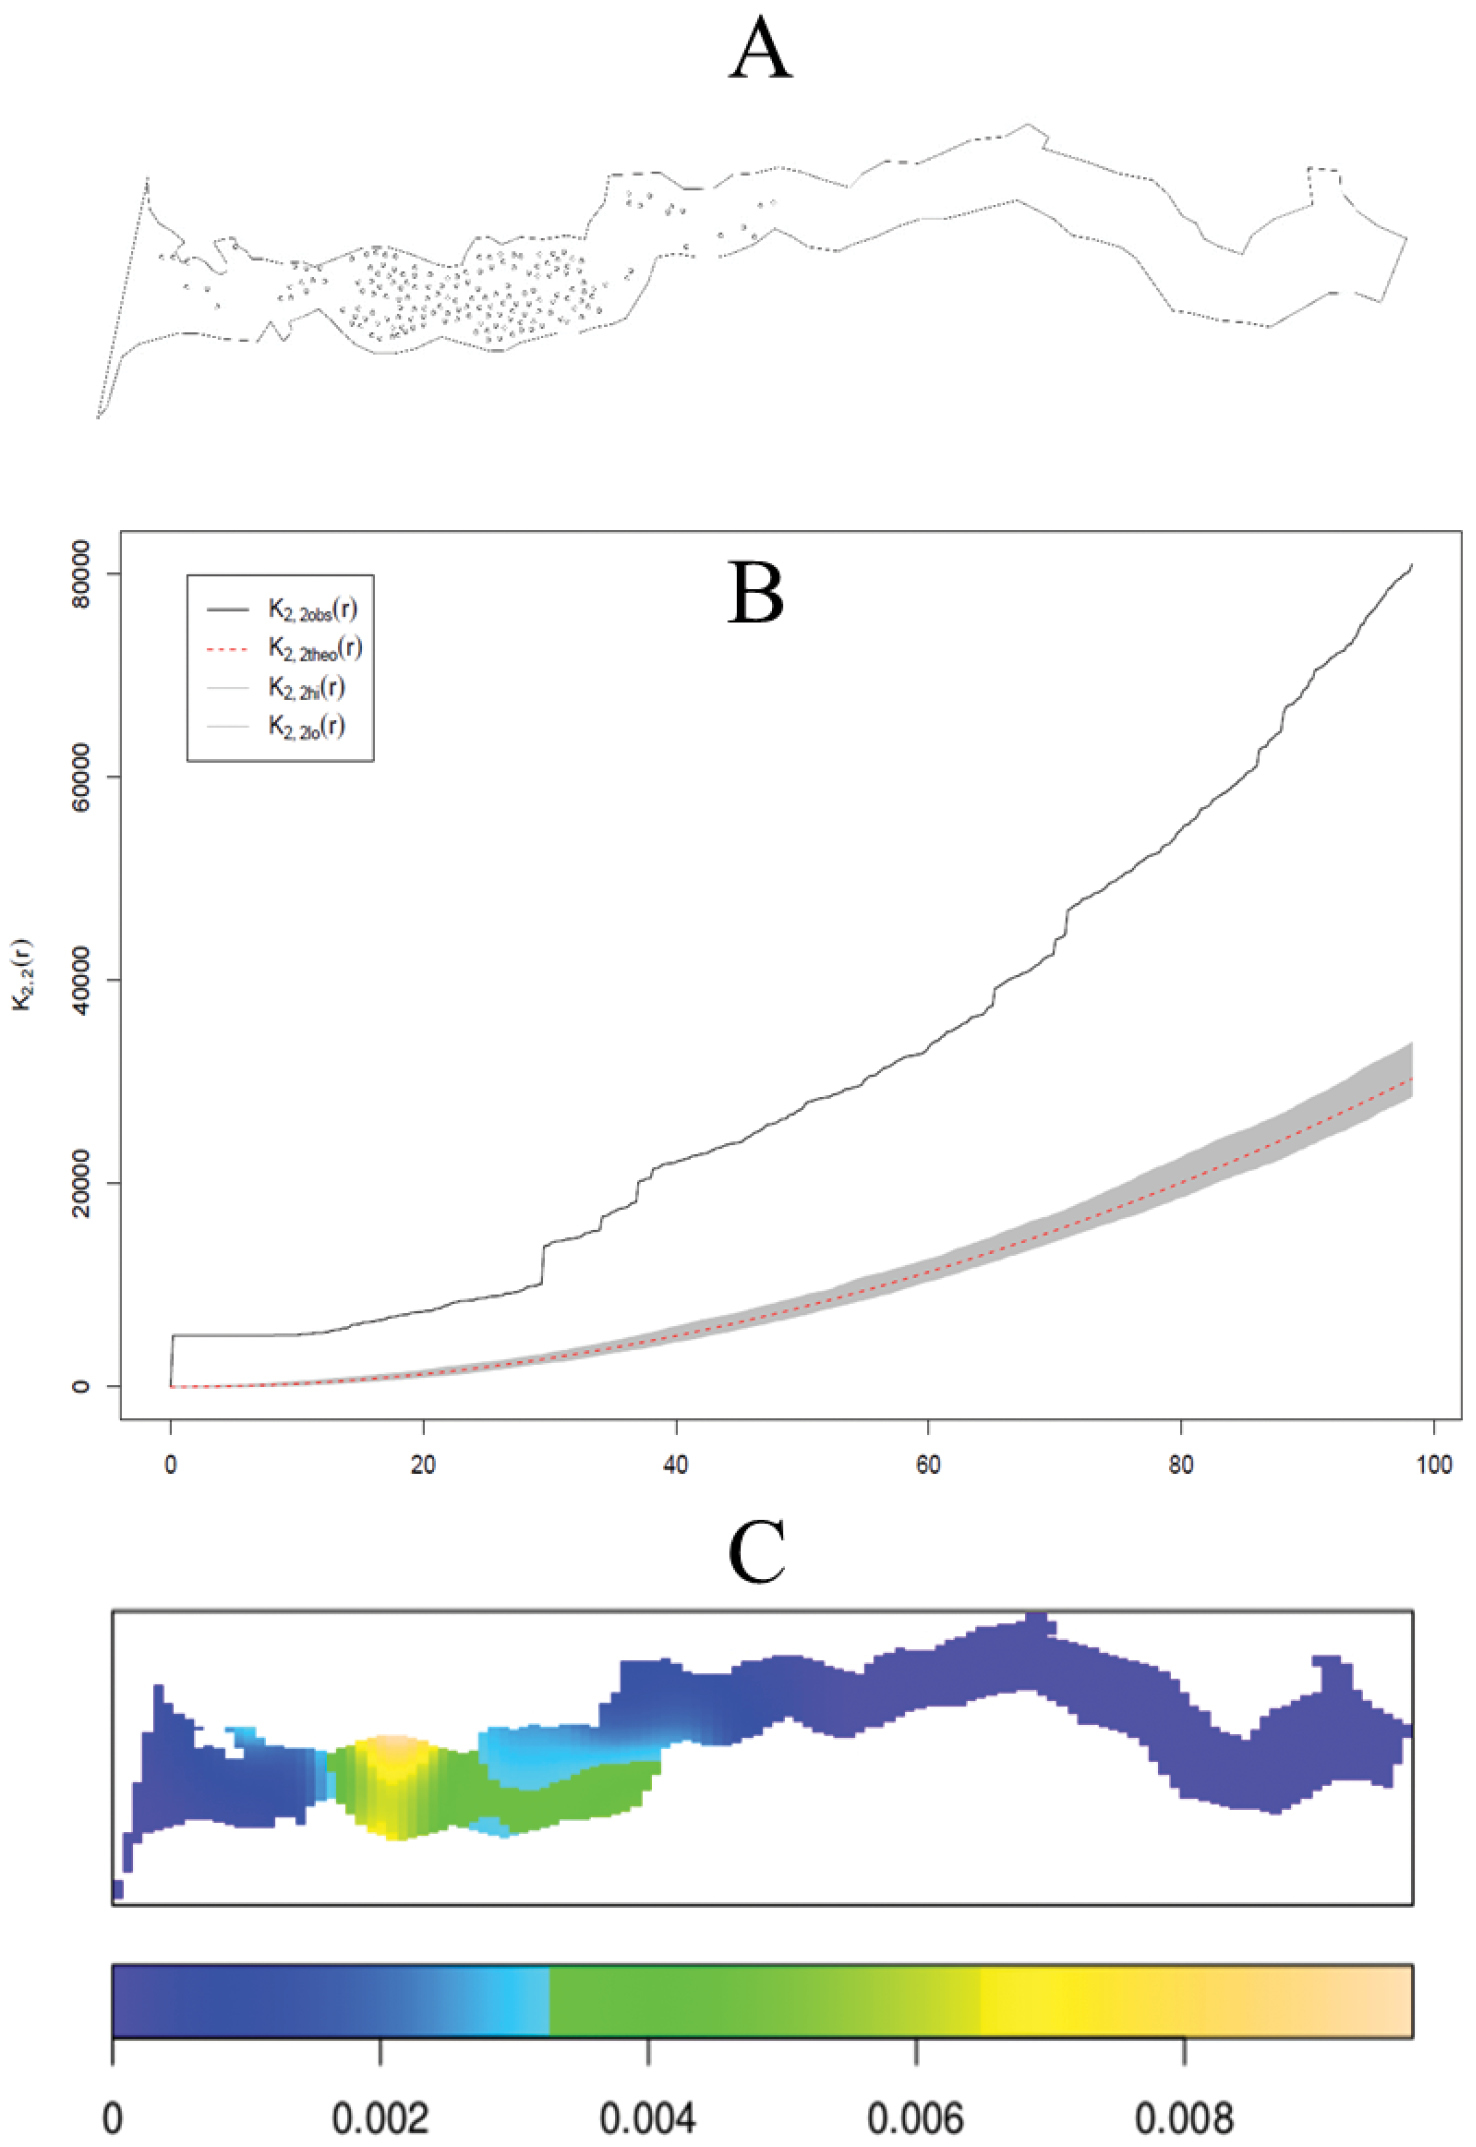
Spatial Point Pattern Analysis of the second monitoring (January 2000). A Dot map and (B), shows the estimations of the function K (r is the distance argument, Dashed line corresponds to the theoretical value of this function is Complete Spatial Randomness and solid lineis the Observed value of the K function for the date pattern) C Map Kernel Estimates of intensity. |