


Citation: Halse SA, Pearson GB (2014) Troglofauna in the vadose zone: comparison of scraping and trapping results and sampling adequacy. Subterranean Biology 13: 17–34. doi: 10.3897/subtbiol.13.6991
Most sampling of troglofauna occurs in caves but troglofauna species are widespread across the vadose zone in Western Australia in iron ore deposits and calcretes. Other than in karstic calcrete, the subterranean spaces in the Western Australian vadose zone are small and often of similar size to the troglofauna inhabiting them. Here we describe how troglofauna can be sampled in the vadose zone using a technique called scraping, in which a haul net is dropped down a hole drilled for geological exploration. We analysed of the results of 10, 895 sampling events in which both the scraping and trapping techniques were used. In the Pilbara region of Western Australia, where most of the fieldwork occurred, scraping collected approximately three-quarters more troglofaunal animals than trapping and more than twice as many troglofauna species per sample. Most orders of troglofauna were collected in greater numbers by scraping than trapping. However, the yields from both troglofauna sampling techniques are low and, even when the results of both techniques are combined to constitute a single unit of sample effort, the currently prescribed effort for environmental impact assessment will document only about half the species present at a site. It is suggested that a larger number of samples should be collected.
Troblobite, subterranean fauna, Australia, sampling method, environmental impact assessment
The study of troglofauna still occurs predominantly in caves across most of the world (e.g.
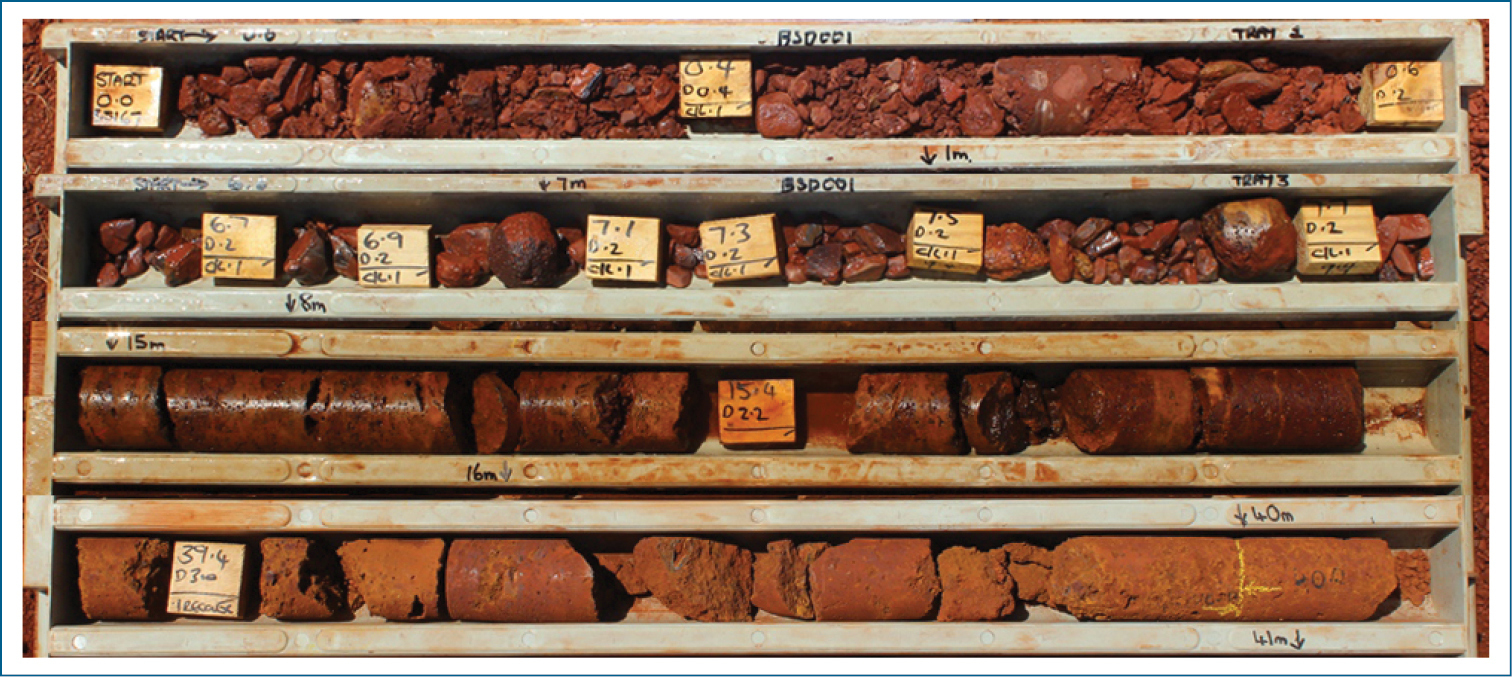
Diamond drilled geological core showing structure of the subterranean habitat from surface to 40 m depth.
Sampling of troglofauna in the vadose zone is challenging, especially in deeper rocky areas. Most of the sampling undertaken in Western Australia is for the purpose of assessing the potential impacts of mining on the conservation of troglofauna (
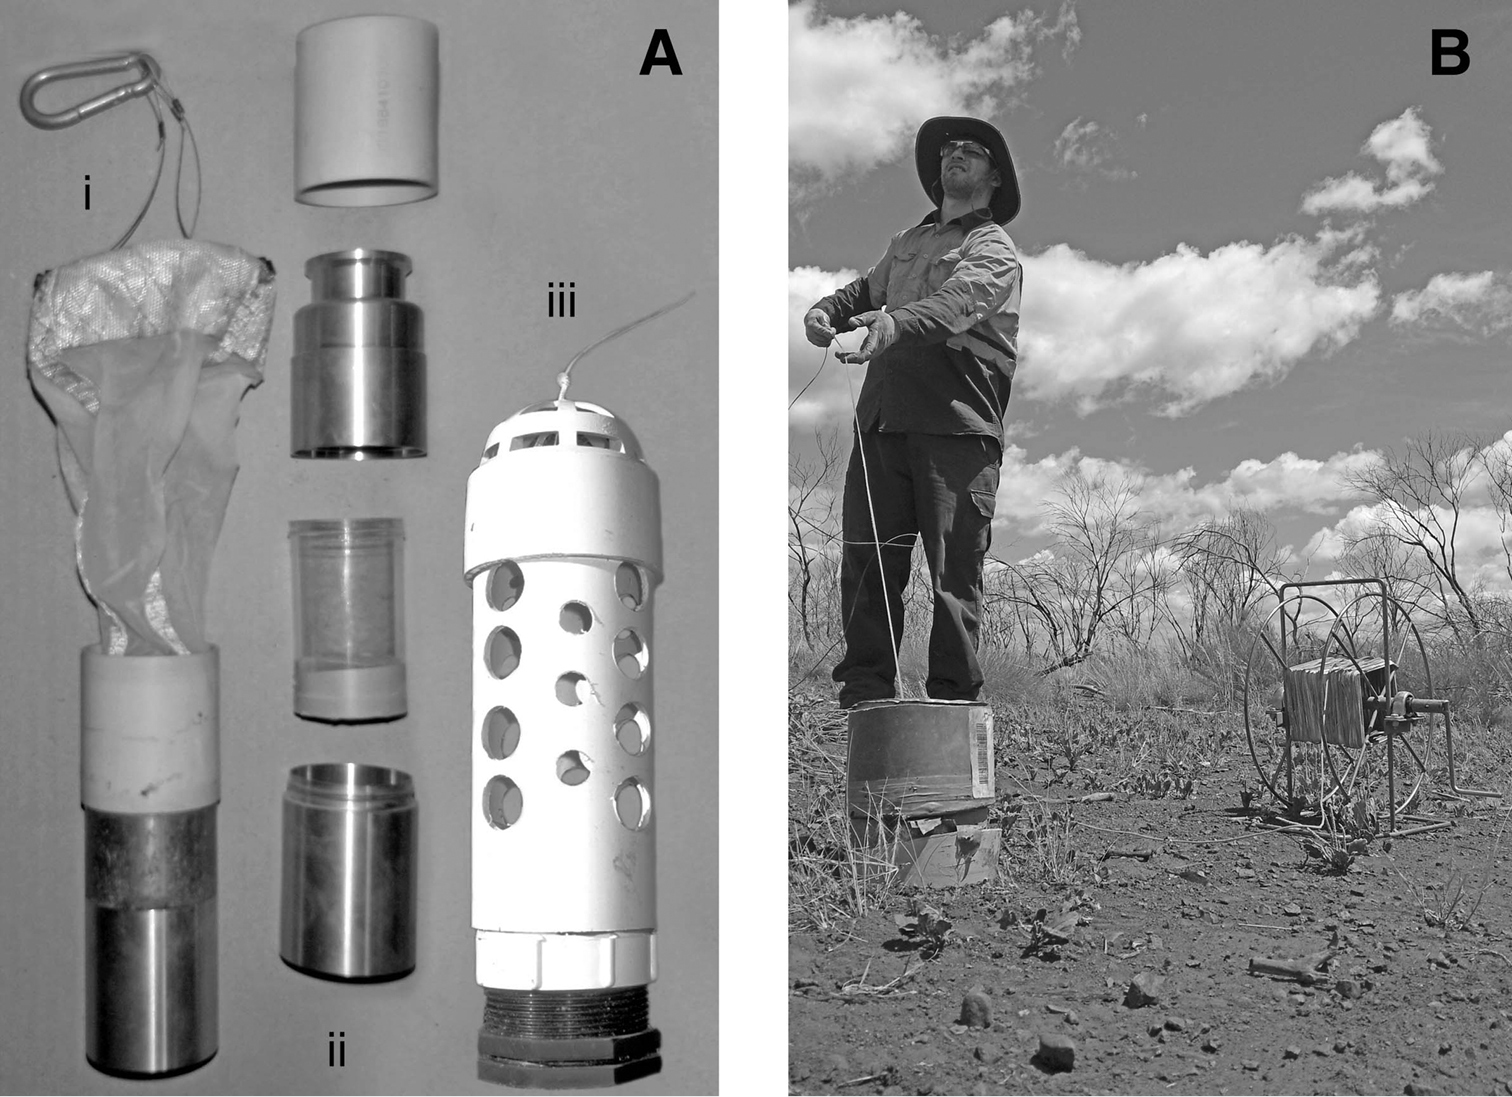
Troglofauna sampling equipment. A net for scraping and trap: i, net assembled; ii, collar, catch tube and protective brass case disassembled; iii, trap B scraping a drill hole in the Pilbara.
Until recently, troglofauna were collected from drill holes using traps baited with leaf litter (
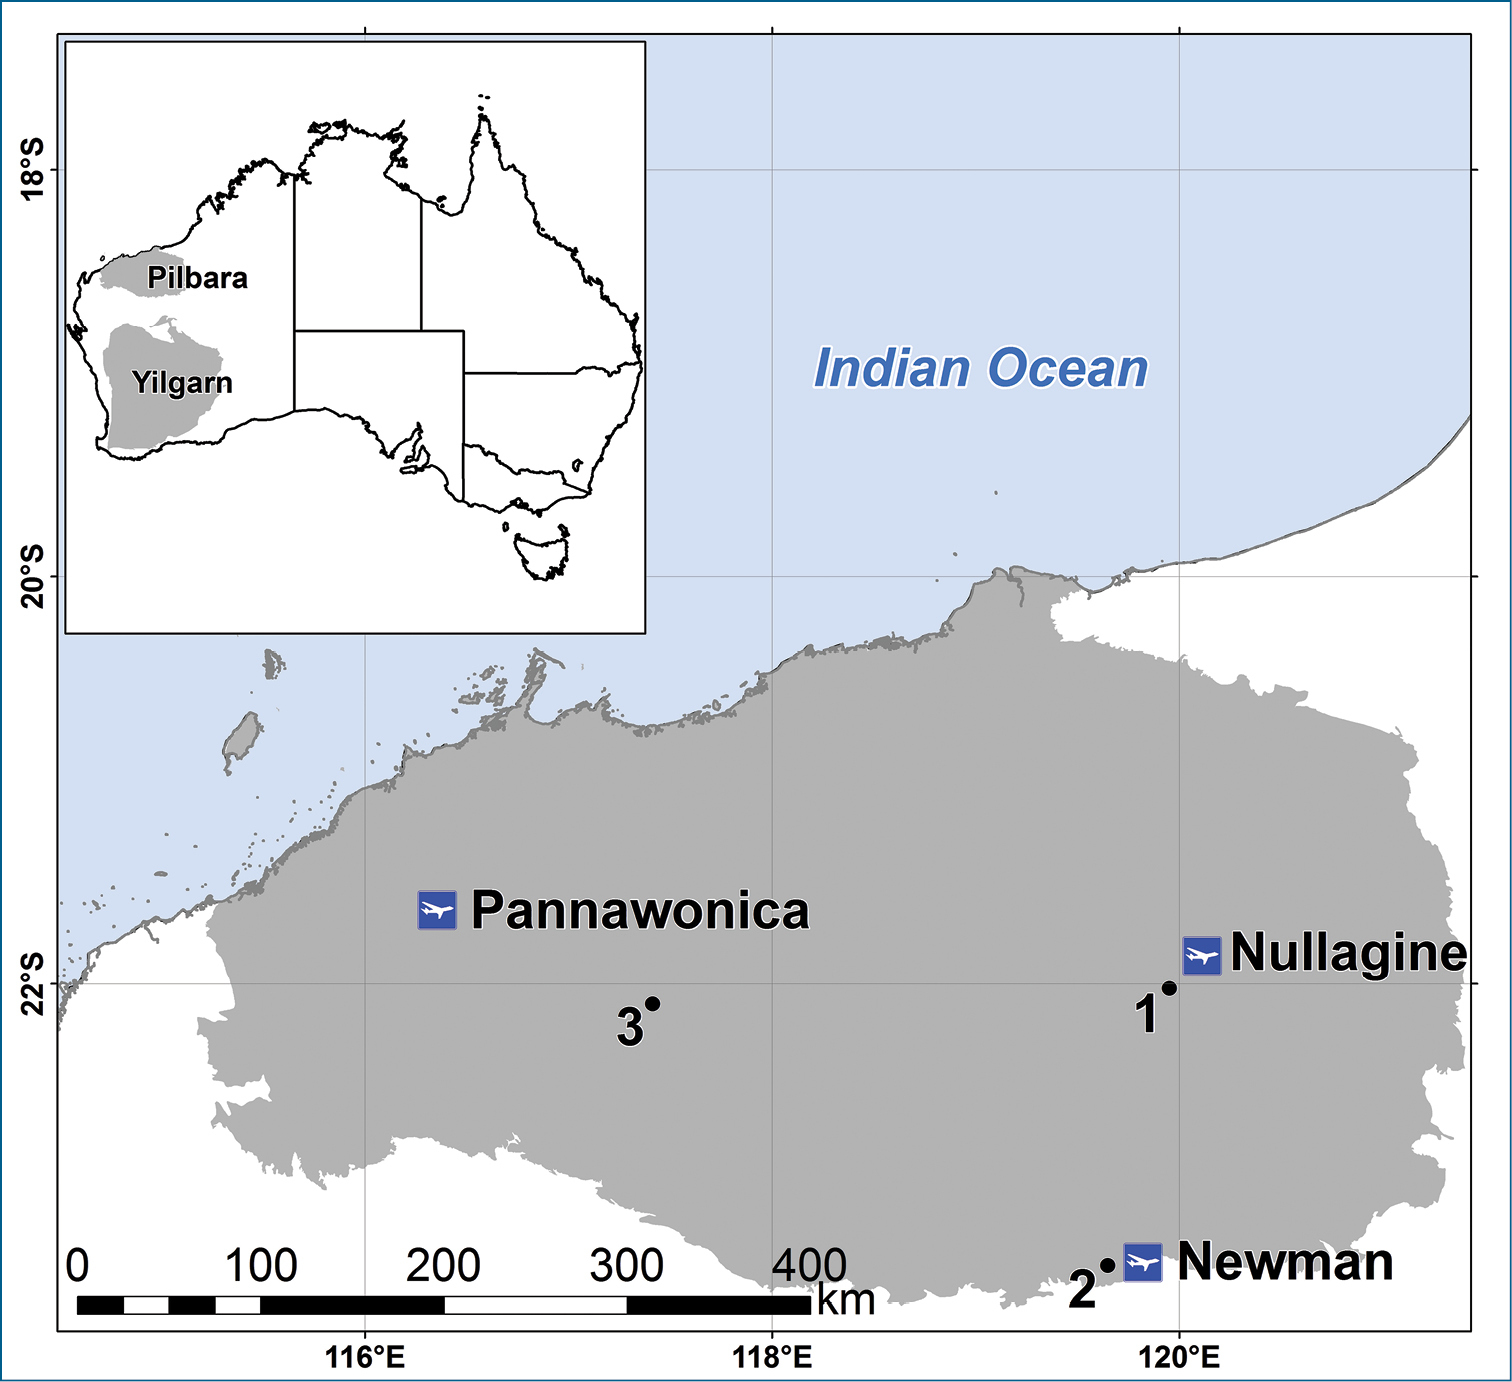
Pilbara and Yilgarn regions of Western Australia, showing some towns in the Pilbara and Areas 1, 2 and 3 where species accumulation curves were calculated.
The primary objective of this paper is to describe, and to document the capture efficiency of a new troglofauna sampling technique called scraping. The implications of low troglofauna capture rates for the completeness of environmental impact assessments are also examined. As a second set of objectives, we briefly describe the troglofauna we have collected in the Pilbara, give some ecological information to improve knowledge of a region with high subterranean fauna conservation values, and highlight the potential richness of non-karstic vadose zones as troglofauna habitat.
The scraping method of collecting troglofauna was developed by modifying a haul net used to sample stygofauna in wells. The principle is simple: a cone-shaped net is dropped down a drill hole and dragged back up against the wall of the hole. Troglofauna crawling on the wall are ‘scraped’ into the net and collected.
Different diameter nets are used for scraping according to the size of holes being sampled, with the ideal net diameter being about 60% of the diameter of the drill hole. The net itself consists of a metal ring, a cone-shaped net of 150 micron mesh and a polycarbonate catching vial (Fig. 2A). The leading edge of the net, which is wrapped over the metal ring, can be reinforced with Kevlar to reduce wear as the net is retrieved. A cylindrical brass weight is attached to the narrow base of the net using cable ties and the 120 mm polycarbonate sample collecting vial is screwed into the brass weight, which has an internal thread. A protective metal base can be fitted around the base of the vial as shown in Fig. 2A.
When collecting data on the troglofauna yield of scraping, the net was lowered to the base of the drill hole and retrieved four times, with the net being dragged against a different sector of the hole during each retrieval. A short metal cylinder was fitted into the collar at the top of the holes while sampling to reduce friction and wear on the nylon cord (see Fig. 2B). In the sampling analysed in this paper, scraping occurred immediately before setting a troglofauna trap.
After each retrieval of the net, the contents of the polycarbonate vial, including sand and stones from the sides of the drill hole, were emptied into a sample jar. The contents of the jar were preserved in 100% ethanol at 4°C after completion of four hauls. In the laboratory, samples were elutriated to separate animals from heavier sediment and screened into size fractions using Endecotts sieves (250, 90 and 53 µm) to remove debris and improve searching efficiency. Samples were then sorted under a dissecting microscope.
The troglofauna traps used were developed from the design of
In the laboratory, the contents of each plastic bag were placed in a Tullgren funnel under 25 watt incandescent lights for 72 h. Most troglofauna moved down through the funnel and dropped into the vial of ethanol below. However, leaf litter was quickly checked under a microscope for any remaining animals and more thorough searching conducted if animals were present.
The geological exploration holes sampled for troglofauna were drilled with a reverse circulation process, whereby rock is broken up by a pneumatic hammer and the rock chips are sent to the surface by air pressure. After drilling, holes were fitted with a short, capped PVC collar extending approximately 1.5 m below ground surface. The purpose of the collar was to prevent collapse of the hole near the surface where substrates are most unstable. The remainder of the hole was open to the surrounding rock matrix. Most holes were 150 mm in diameter and drilled between six months and several years prior to sampling. Approximately 30% of the holes sampled were <30 m deep and 70% were <50 m deep but 2% of holes were >300 m deep. All drill holes sampled in the Pilbara were vertical but about a quarter of the holes sampled in the Yilgarn were inclined 30° from vertical.
With the exceptions of nematodes, oligochaetes, mites and collembolans, all invertebrate animals exhibiting some troglomorphies were considered to be potential troglofauna and were identified to species or morphospecies level. While a few species could be identified using available keys, most of the time the characters employed in keys for surface taxa were used to construct morphospecies taxonomy. In addition to the use of keys, expert taxonomists were consulted and many specimens were examined genetically to help determine species boundaries (see Acknowledgments).
Nematodes, oligochaetes, mites and collembolans were excluded from study partly because existing information provided insufficient basis to separate Pilbara and Yilgarn species of troglofauna from surface relatives but also because it was not a regulatory requirement to identify these groups (
The data analysed in this paper came from a large number of sampling events when both a scrape and a trap sample were collected from the drill hole at the same time. Given that the trap was set immediately after scraping, it was regarded as a contemporaneous sample, even though it was retrieved eight weeks later. Sampling occurred in 65 different areas within the Pilbara (90% of effort) and the eastern Yilgarn regions of Western Australia (Fig. 3), with most drill holes being sampled twice in different seasons. The areas varied in size from about 2–400 km2 but were mostly <10 km2. When two traps were set in one drill hole, trapping results were combined prior to making a comparison with the equivalent scrape sample.
Two types of analysis occurred using the entire dataset. First, the total numbers of species and animals collected in trap and scrape samples were compared. Second, the numbers of animals in traps and scrapes were compared for various orders represented by ≥6 specimens. The differences between numbers of animals in traps and scrapes were expressed as bias factors by dividing the number of specimens caught in the higher yielding sampling technique by the number caught in the lower yielding one and converting this ratio to its base10 logarithm. When the higher yielding technique was trapping, the logarithm was assigned a negative value. Chi-squared tests were used to examine the significance of differences in numbers of animals collected by the two techniques.
In a third analysis, based on data from three areas in the Pilbara, species accumulation curves for scraping, trapping and combination sampling (i.e. collection of both trap and scrape samples) were calculated for each area using EstimateS software (
In addition to the above analyses of sampling efficiency, we used convex hulls to calculate the ranges of all species represented in the entire dataset by records from ≥3 drill holes. We also examined the depth below ground surface at which species were trapped, using records from single traps or the deeper trap if two traps were set in a drill hole. Chi-squared goodness of fit tests were used to test for variations in occurrence of invertebrate orders with depth.
A total of 9882 individual specimens considered to be troglofauna, representing 658 species, were collected in the 10, 895 troglofauna sampling events. Of these, 9252 individuals of 566 species were collected from the Pilbara and 630 individuals of 92 species were collected from the Yilgarn (six species were considered to occur in both areas). Diplurans, isopods, beetles, pseudoscorpions and schizomids are the more speciose troglofauna groups in the Pilbara and Yilgarn (Fig. 4).
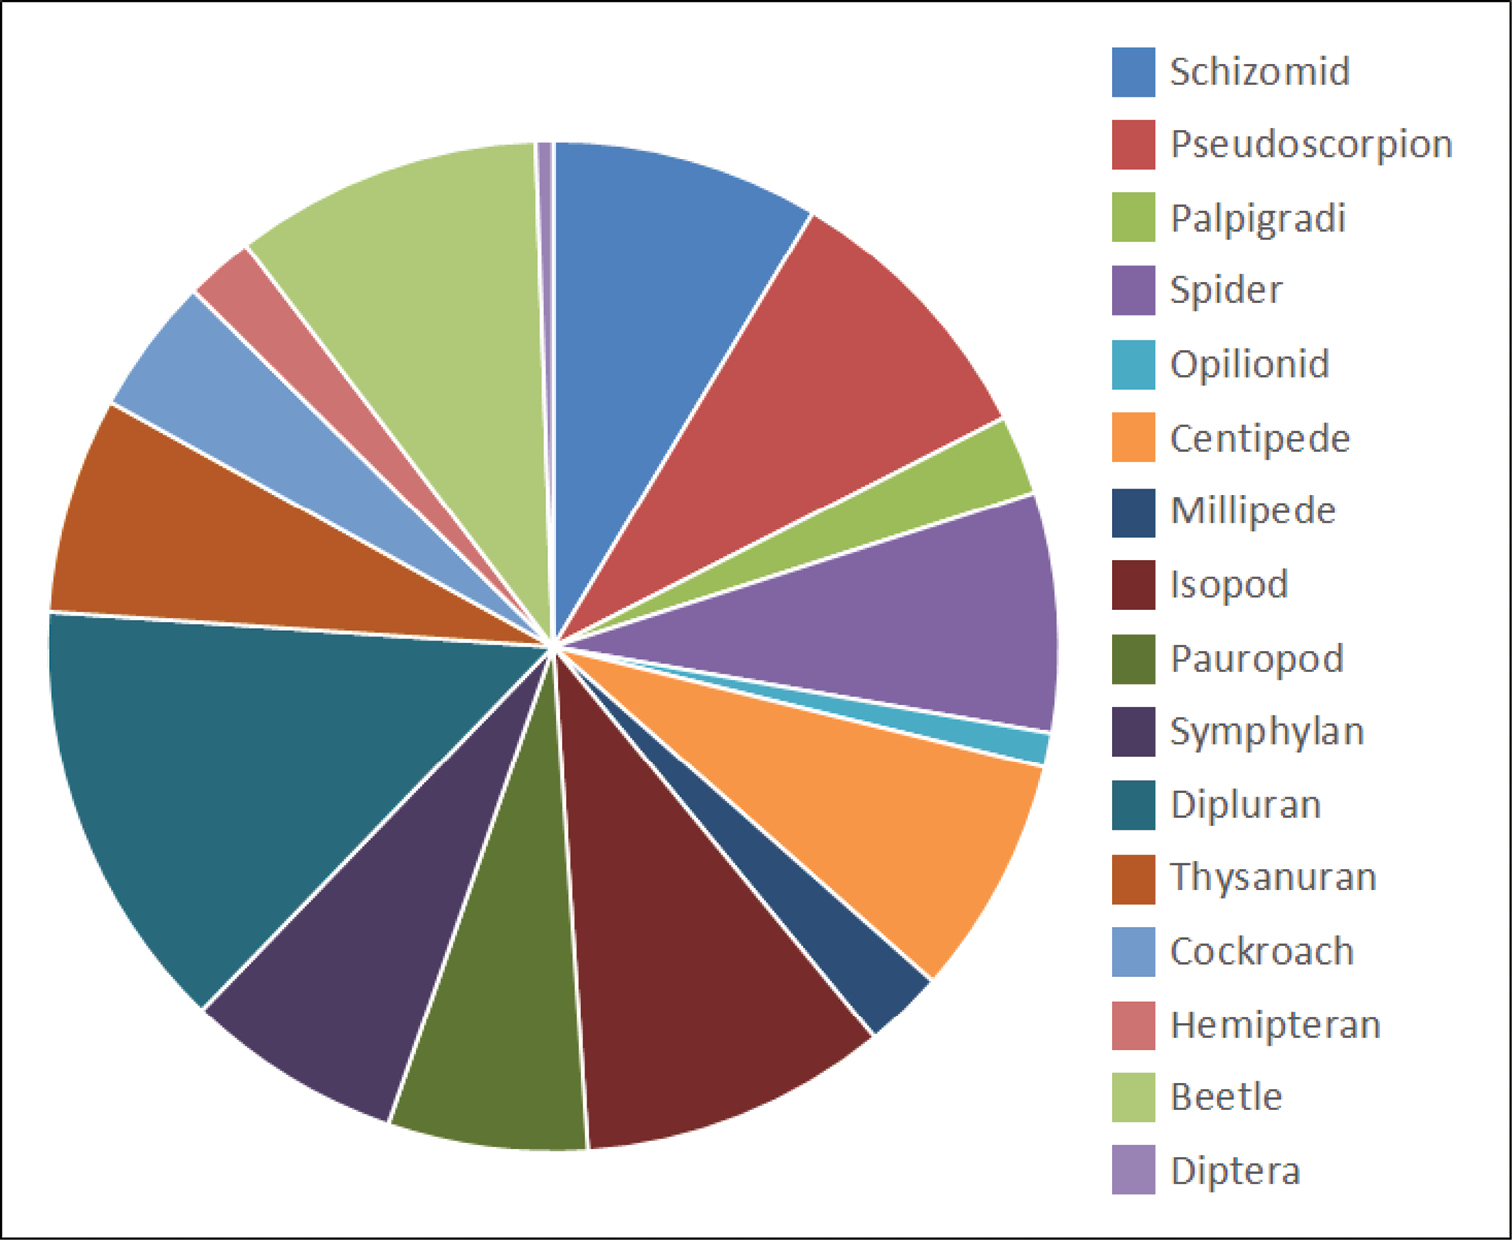
Taxonomic composition of troglofauna in the Pilbara and Yilgarn. Orders in legend are shown clockwise from the top of the pie chart.
Scraping collected 76% more troglofaunal specimens than trapping (5115 vs. 2907) and more than twice as many species per sample (0.25 vs. 0.11, Table 1) in the 9815 sampling events in the Pilbara. Differences between the two techniques were less pronounced in the Yilgarn, with the scraping component of 1080 sampling events collecting 29% fewer specimens than trapping but 10% more species. The lower success of scraping in the Yilgarn was probably partly the result of many Yilgarn drill holes being inclined and logistically difficult to sample by scraping (although retrieving traps was also difficult).
Numbers of troglofauna collected by scraping and trapping in the Pilbara and Yilgarn.
| Pilbara | Yilgarn | Total | ||||
|---|---|---|---|---|---|---|
| Scrape | Trap | Scrape | Trap | Scrape | Trap | |
| Total animals | 5115 | 2907 | 208 | 292 | 5323 | 3199 |
| Animals per sample | 0.52 | 0.30 | 0.19 | 0.27 | 0.49 | 0.30 |
| Species per sample | 0.25 | 0.11 | 0.10 | 0.09 | 0.23 | 0.10 |
Altogether, 20 orders of troglofauna represented by ≥6 individuals were collected from the Pilbara (excluding nematodes, oligochaetes, mites and collembolans). Thirteen orders yielded substantially more specimens in scrapes (1.2–100 times more) than traps (Fig. 5, Table 2). These orders included symphylans, pauropods and palpigrads, which were almost exclusively collected in scrape samples. Coleoptera were collected in equal numbers in scrapes and traps, while millipedes, isopods and dipterans were more abundant in traps. However, among the four millipede orders, the higher abundances in traps were significant only for Polydesmida and Spirobolida.
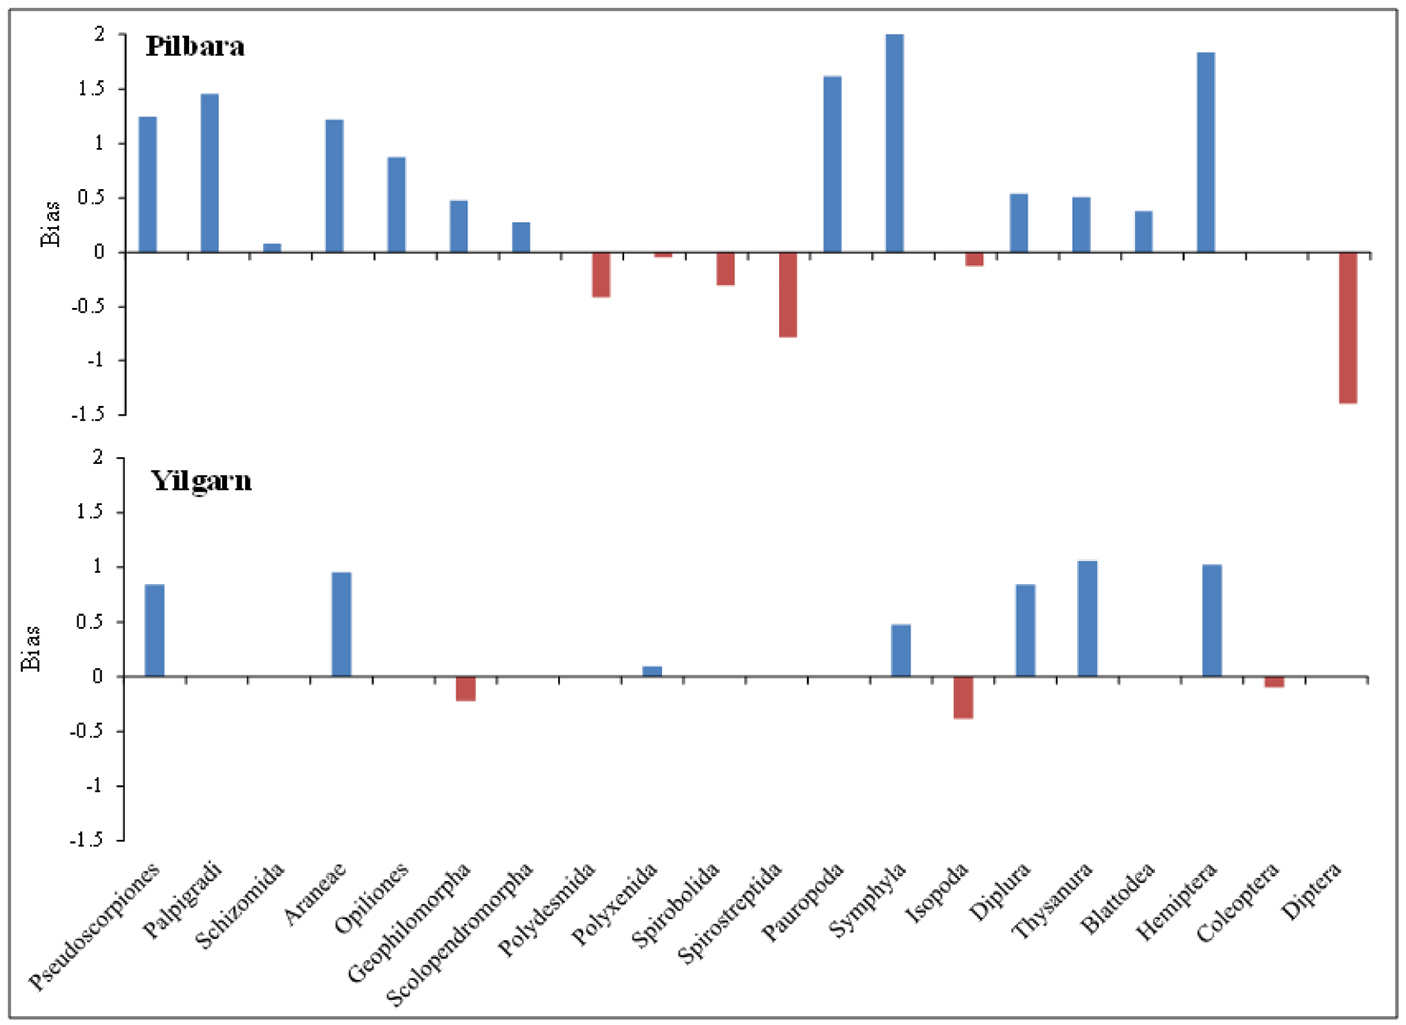
Bias in capture of different orders of troglofauna in the Pilbara using scraping and trapping.
Differences between orders in numbers of animals collected by scraping and trapping. P values for χ2 goodness of fit testing assuming equal numbers of animals in traps and scrapes. NS, non-significant.
| Pilbara | Yilgarn | |||||
|---|---|---|---|---|---|---|
| Trap | Scrape | P | Trap | Scrape | P | |
| Pseudoscorpiones | 9 | 158 | 0.001 | 0 | 6 | NS |
| Palpigradi | 4 | 114 | 0.001 | |||
| Schizomida | 258 | 309 | 0.05 | |||
| Araneae | 11 | 183 | 0.001 | 1 | 9 | 0.05 |
| Opiliones | 2 | 15 | 0.01 | |||
| Geophilomorpha | 6 | 18 | 0.05 | 5 | 3 | NS |
| Scolopendromorpha | 19 | 36 | 0.05 | |||
| Polydesmida | 49 | 19 | 0.001 | |||
| Polyxenida | 360 | 325 | NS | 4 | 5 | NS |
| Spirobolida | 4 | 2 | NS | |||
| Spirostreptida | 36 | 6 | 0.001 | |||
| Pauropoda | 3 | 124 | 0.001 | |||
| Symphyla | 2 | 204 | 0.001 | 6 | 18 | 0.05 |
| Isopoda | 312 | 234 | 0.01 | 263 | 109 | 0.001 |
| Diplura | 47 | 162 | 0.001 | 0 | 6 | NS |
| Thysanura | 122 | 392 | 0.001 | 2 | 23 | 0.001 |
| Blattodea | 465 | 1117 | 0.001 | |||
| Hemiptera | 20 | 1370 | 0.001 | 2 | 21 | 0.001 |
| Coleoptera | 288 | 288 | NS | 5 | 4 | NS |
| Diptera | 889 | 36 | 0.001 | |||
Dipterans collected in the Pilbara nearly all belonged to the family Sciaridae, which were collected as larvae or recently hatched adults. Nearly all were caught in traps. Eggs were also found in traps, which appeared to constitute favourable breeding habitat for sciarids, with eggs hatching and producing larvae and even adults while the traps were in place.
The results of sampling in the Yilgarn were similar to those in the Pilbara, with 10 orders represented by ≥6 animals and six of these collected mostly in scrapes (Fig. 5). Coleoptera, the centipede order Scolopendromorpha and millipede order Polyxenida were collected in approximately equal numbers in scrapes and traps, while isopods were more abundant in traps.
Many of the animals collected in scrapes, especially hemipterans, were found in root mats broken off by the net and scraping may be a particularly efficient way of sampling this microhabitat.
The greater efficiency of scraping, compared to trapping, as a means of documenting the troglofauna of an area was confirmed when species accumulation curves were plotted for three areas in the Pilbara. Scraping yielded 33–57% more species than trapping (Fig. 6). However, both scraping and trapping collected low numbers of animals, so that combining the results of trapping and scraping for each drill hole yielded 25–38% more species than were recorded by scraping alone.
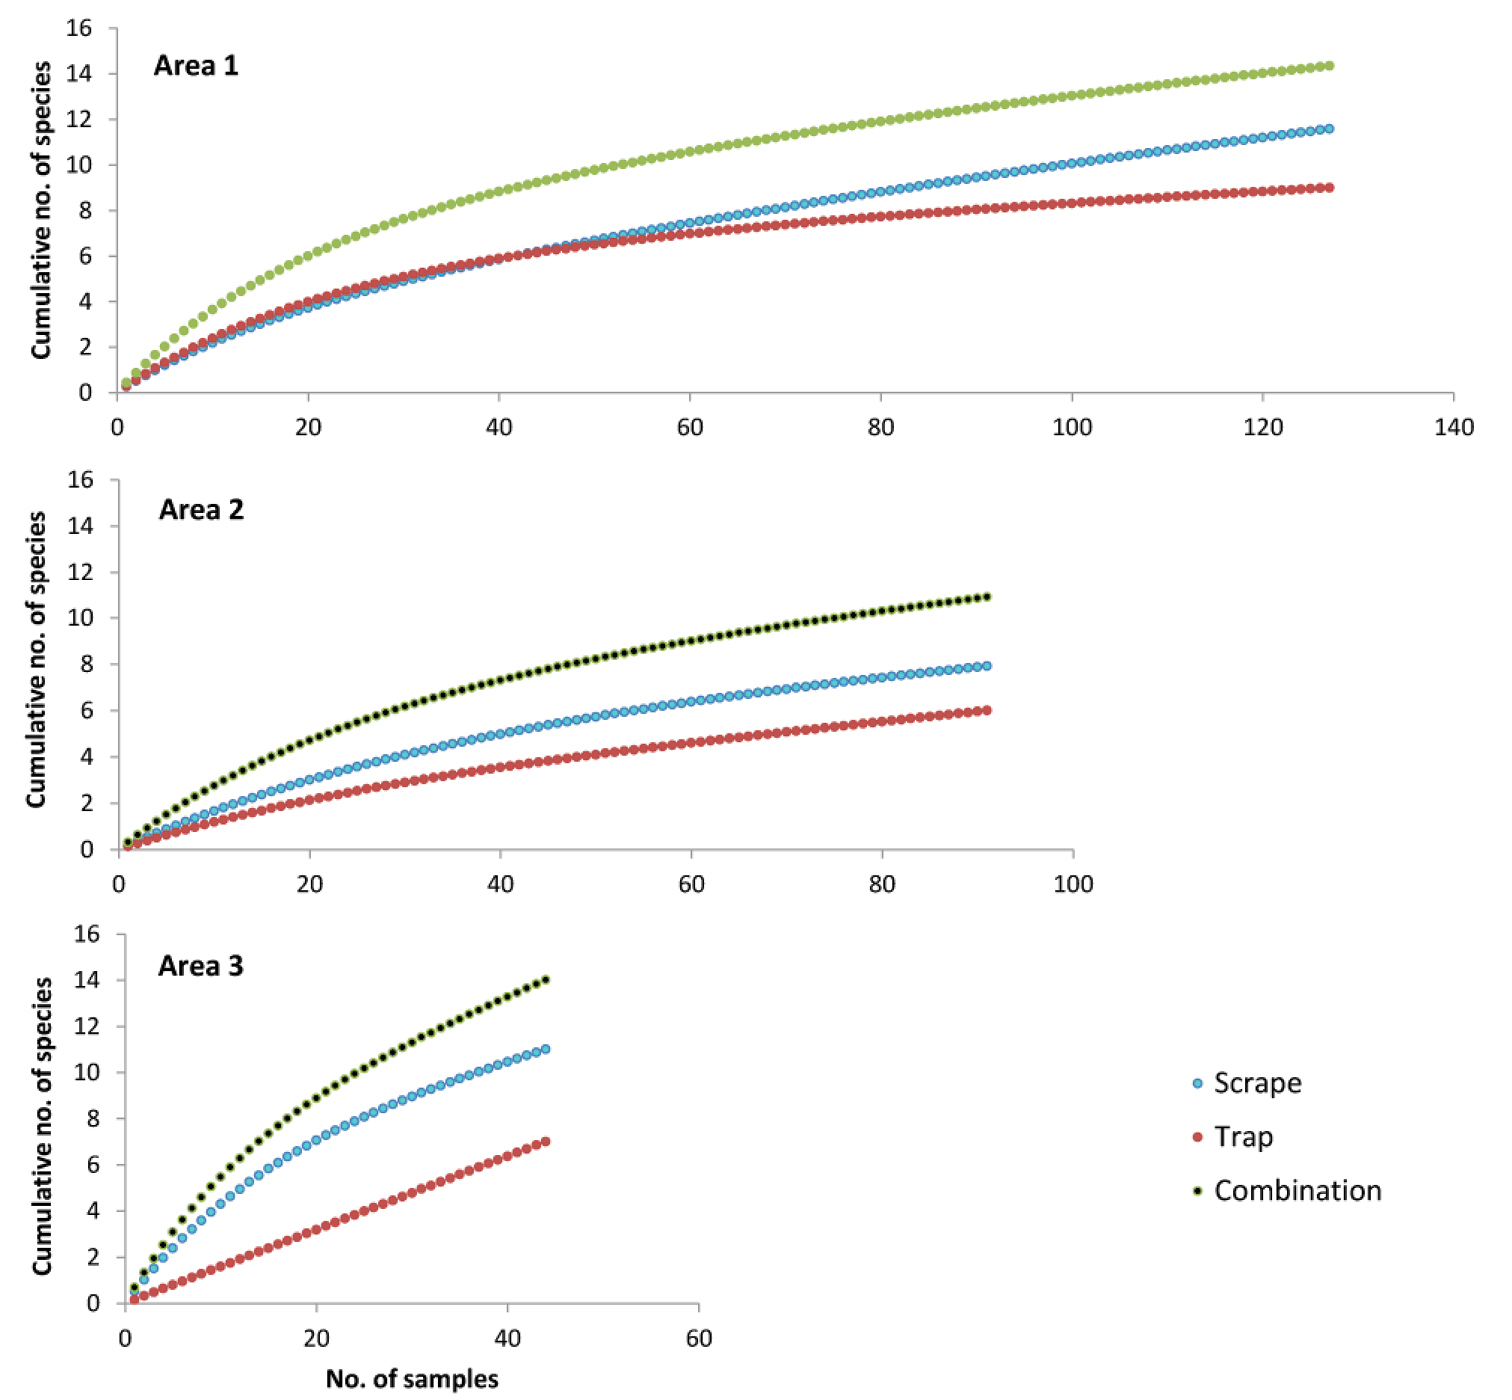
Cumulative numbers of species collected by different trapping protocols in three different areas in the Pilbara (see Fig. 3 for locations). A sample consists of one scraping event, one trapping event (with one or two traps), or the combined results of one scraping and one trapping event in the same hole.
While combination sampling (i.e. collecting both scrape and trap samples) is more efficient than either scraping or trapping alone, a very large sampling effort may still be required with combination sampling to collect most (e.g. 80%) of the troglofauna species present in an area. The 127 combination samples from Area 1 and 91 combination samples from Area 2 collected only 69% and 66%, respectively, of the estimated troglofauna species in these areas. Area 1 yielded 66 animals and 5 singletons (species represented by a single individual), whereas Area 2 yielded 145 animals and 3 singletons. Sampling appeared to collect additional species faster at Area 3 but the fauna there was also richer, so that only 58% of species were collected by 44 combination samples (Fig. 6). The 59 animals collected included 5 singletons. No species was collected from more than one area, despite a small number of species being wide-ranging in the Pilbara (see below).
Both trapping and scraping mostly collected animals inhabiting the surface soil and gravel layers rather than troglofauna. Approximately 97.7 and 93.6% of specimens collected by trapping and scraping, respectively, were classified as surface species rather than troglofauna. While some species classified as surface may be living at depth (see Discussion), the high proportion of surface fauna in the traps and scrapes was the probably mostly the result of two inter-related processes. First, the drill hole was likely to have acted as a conduit for surface fauna to explore the vadose zone by travelling down the outside of the collar onto the walls of the hole. Second, the drill hole was also likely to have acted as a pit trap for much of surface fauna exploring it.
Examination of the depths at which species of different groups were collected showed that all groups recorded frequently in traps were found at depths >40 m (Table 3). No groups showed significant variation in occurrence with depth, although isopods showed a possible tendency to occur more frequently in shallow depths, dipterans to be more common at >20 m depth and schizomids to prefer depths of <40 m.
Percentage of various troglofauna groups in trap samples from different depths. Polydesmida, Polyxenida, Spirobolida and Spirostreptida combined as Diplopoda. No traps set at >80 m depth.
| <10 m | 10–19m | 20–39 m | 40–80 m | |
|---|---|---|---|---|
| Schizomida | 21 | 22 | 19 | 10 |
| Diplopoda | 16 | 13 | 14 | 17 |
| Isopoda | 22 | 15 | 7 | 8 |
| Diplura | 2 | 4 | 6 | 5 |
| Blattodea | 21 | 25 | 24 | 31 |
| Coleoptera | 4 | 5 | 6 | 8 |
| Diptera | 2 | 5 | 10 | 9 |
| Other | 12 | 11 | 14 | 12 |
| No of species records | 110 | 317 | 288 | 119 |
The ranges of species represented by few records are likely to be underestimated by our convex hull calculations. Nevertheless, it appeared that troglofauna species in the Pilbara and Yilgarn predominantly had very small ranges. Of the 230 species recorded in ≥3 drill holes, 77% had calculated ranges of <10 km2 and only 4% had ranges >10, 000 km2. Groups with particularly small calculated ranges included isopods, spiders, schizomids and harvestmen (although the latter was represented by only two species) (Table 4). The ranges estimated here for schizomid species fit well with estimates for schizomids elsewhere in the Pilbara (
Median ranges of species collected in ≥3 drill holes. The spread of species ranges is also shown. N, number of species in group. Scolopenromorpha and Geophilomorpha combined as Chilopoda, Polydesmida and Polyxenida combined as Diplopoda.
| Median range km2 | N | Species ranges km2 | |
|---|---|---|---|
| Pseudoscorpiones | 22 | 22 | 1–145994 |
| Palpigradida | 345 | 4 | 1–35642 |
| Schizomida | 5.4 | 29 | 1–55 |
| Araneae | 3.7 | 18 | 1–1413 |
| Opiliones | 1.2 | 2 | 1–2.4 |
| Chilopoda | 30 | 10 | 1–2166 |
| Diplopoda | 16 | 6 | 1–353159 |
| Pauropoda | 34 | 6 | 1–7148 |
| Symphyla | 8.3 | 22 | 1–1368 |
| Isopoda | 2.5 | 30 | 1–1462 |
| Diplura | 16 | 15 | 1–12282 |
| Thysanura | 11 | 22 | 1–1845 |
| Blattodea | 29 | 19 | 1–2166 |
| Hemiptera | 3646 | 6 | 1–43501 |
| Coleoptera | 60 | 18 | 1–17772 |
| Diptera | 19725 | 2 | 1–39448 |
All groups other than schizomids and harvestmen contained some moderately or very widespread species and, in many cases, these may represent troglophiles. The widespread species included a ubiquitous polyxenid millipede Lophoproctidae sp. B01 found both in the Pilbara and Yilgarn, the pseudoscorpion Tyrannochthonius aridus found on the surface and below ground, the hemipteran Meenoplidae sp. B03 of which adults have remnant eyes (eyeless species had ranges of 461 and 10 km2), and the dipteran Sciaridae sp. B01.
While the main purpose of this paper is to highlight the value of scraping as a technique for collecting troglofauna from the vadose zone, the results of the sampling reported here also show that the Pilbara region of Western Australia supports a significant troglofauna community and complements the results of other subterranean surveys showing the Pilbara is rich in stygofauna (
A much more significant issue is that <1% of the Pilbara has been sampled. While most of the areas sampled are iron formations, which current information suggests support more troglofauna than other geologies of the region (
Perhaps the most interesting points to note in relation to the richness of troglofauna in the Pilbara are that firstly it is a fauna of small spaces in the landscape matrix of the vadose zone rather than a fauna of caves and, secondly, it occurs in a very arid setting. Average annual rainfall in the Pilbara is 250-400 mm and average maximum January temperature is 39–41 °C (http://www.bom.gov.au/climate/averages/tables/ca_wa_names.shtml , see Fig. 3 for locations). Annual pan evaporation is approximately 3500 mm (
We believe our recognition of species boundaries was mostly sound but we excluded a potentially significant number of species from our troglofauna list by ignoring mites, collembolans and oligochaetes. On the other hand, some of the species we recorded as troglofauna may be soil fauna. The possible inclusion of some soil species reflects the difficulty of assigning animals to ecological categories on the basis of morphological information (
The difficulties of categorising species is illustrated by paligradids and pauropods. Both groups were collected almost entirely by scraping. Although Western Australian palpigradid species appear to lack the elongated appendages typical of most cave palpigradids,
After morphological examination, Ulf Scheller (personal communication) concluded that Pilbara pauropods are predominantly, if not entirely, surface fauna. However, two lines of evidence suggest the morphology and ecology of pauropods may not be matched. First, it seems surprising for osmoregulatory reasons that pauropods occur in surface soils of an area as hot and arid as the Pilbara, although they have been collected from arid surface habitats in Israel (
There is also evidence from Cape Range, just south of the Pilbara, that species lacking troglomorphies may use subterranean environments as refugia from arid surface conditions.
The non-karstic vadose zone appears to have been relatively little sampled for troglofauna anywhere other than Australia, despite its potential to harbour very significant biodiversity. Consequently, the yields of trapping and scraping cannot readily be compared to sampling methods used elsewhere. However, the traps used in this study were baited with wet leaf litter. Other studies have shown that the addition of water and leaf litter to an arid zone cave attracted troglobitic species, provided a site for their reproduction (
In the rocky iron ore formations of the Pilbara, scraping yielded approximately three-quarters more troglofaunal animals and twice as many species per sample as recorded by trapping (Table 1). Nearly all groups of troglofauna were collected more efficiently by scraping, so that use of that technique provided a more complete picture of the troglofauna community than if trapping alone was used (Figs 5, 6). Fewer samples were collected in the rocky iron ore and gold bearing formations sampled in the Yigarn and capture rates were lower than in the Pilbara. These lower capture rates were probably the result of logistical issues associated with sampling inclined holes and the fact that fewer troglofauna occur in Yilgarn habitats other than calcrete (see
The low yields of trapping and scraping have implications for the adequacy of environmental impact assessments in regions where troglofauna occur. In such regions, the identification and protection of areas that are particularly rich in troglofauna should be a conservation priority. Using trapping alone, only about a third of the troglofauna species present in Areas 1 and 2 would be collected by the 60 samples recommended for impact assessment by
The relatively small proportion of species collected by troglofauna sampling using currently recommended levels of effort is probably the result of two factors. First, the number of species in a sample and the degree to which the sample collects all species from an area is dependent on the number of animals collected (
Three broad conclusions are drawn from this study.
First, the non-karstic vadose zone of the Pilbara is rich in troglofauna. This is likely to be the case in many other parts of the world and more surveys should be conducted to identify the general importance of the non-karstic habitats globally. Holes drilled for geological exploration associated with mine development provide easy access to the deeper vadose zone.
Second, scraping appears to be a useful technique for sampling troglofauna in the vadose zone. Under at least some circumstances, it yields more fauna and provides results faster than trapping because there is no colonisation period required. However, because of the relatively low yields of all sampling methods for troglofauna trialled to date, we suggest scraping and trapping should usually be used in combination to maximise yields.
Third, the low yields obtained from troglofauna sampling highlight the importance of identifying, prior to sampling, the proportion of the fauna that needs to be collected to adequately characterise a troglofauna community for the purposes of environmental impact assessment. Analyses should be conducted during assessment to evaluate whether this target has been met.
We are very grateful to the other staff at Bennelongia who undertook the field collecting and sample processing on which this paper is based, especially Jim Cocking and Mike Scanlon. We thank Sean Bennett and Rowan Lymbery for assisting with data collation, Jane McRae for preparing Figs 1 and 2 and Mike Scanlon for preparing Fig. 3. Advice and assistance with species level identifications was sought from Barbara Baehr (spiders), Pablo Barranco (palpigradids), Martin Baehr, Lars Hendrich, Al Newton and Pier Mauro Giachino (beetles), Catherine Car (millipedes), Greg Edgecombe (centipedes), Mark Harvey (pseudoscorpions, schizomids), Marius Koch (diplurans), Ulf Scheller (pauropods), Graeme Smith (thysanurans), Fred Stone (cockroaches), Stefano Taiti (isopods) and Erich Volschenk (scorpions). Genetic analyses were conducted by Terrie Finston (Helix Molecular Solutions), Remko Leijs (South Australian Museum) and Mark Castalanelli (Western Australian Museum).