|
||
|
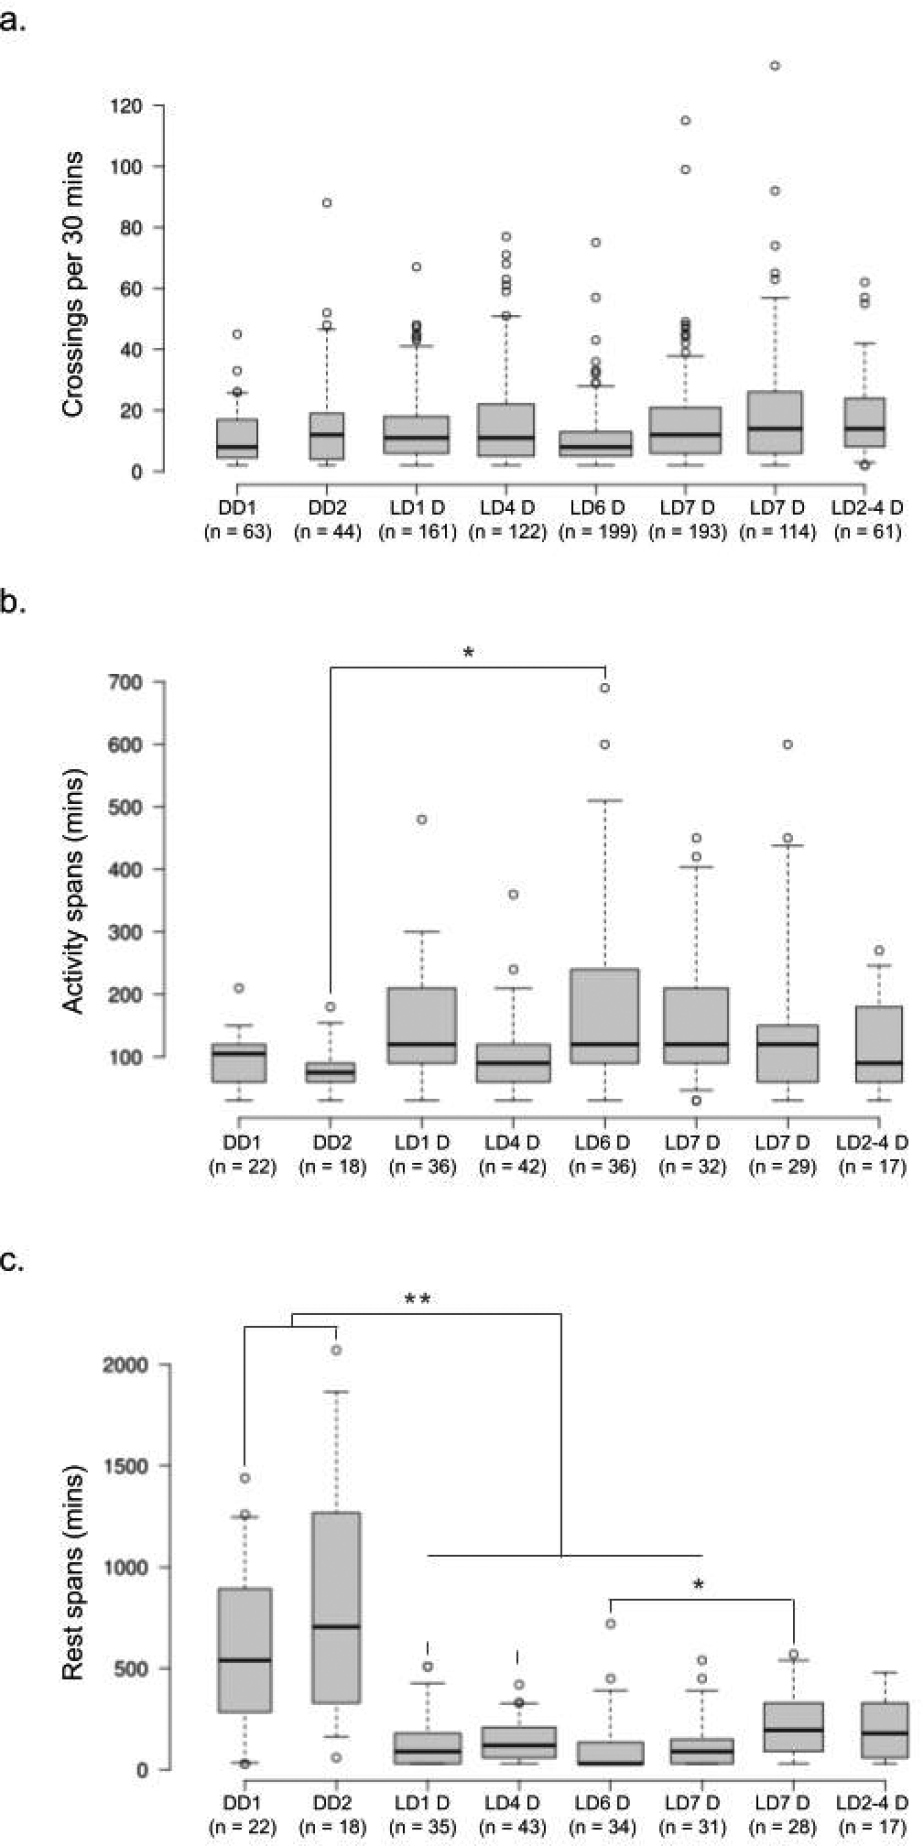
Analyses of rest-activity in long-term DD- and LD-adjusted animals a–c box plots, visualizing the relative numbers of observations as widths of boxes median values as back bars inside boxes. Altman whiskers extending from 5th to 95th percentile. Each comparison shows the results for the two long-term DD-adjusted animals (DD1 and DD2) followed by the results for the six long-term DD-adjusted animals (LD1, LD4, LD6, LD7, LD8, and LD2-4 in the D-phase a comparison of activity intensities measured as the number of tube crossings per discrete activity bout. Time intervals with less than 2 tube crossings were excluded. Numbers of bouts per animal is given in parentheses. Kruskal-Wallis ANOVA detected no statistically significant differences after adjustment for multiple comparisons b comparison of activity bout durations with numbers of bouts per animal given in parentheses c comparison of resting period durations with numbers of resting periods per animal given in parentheses. |