|
||
|
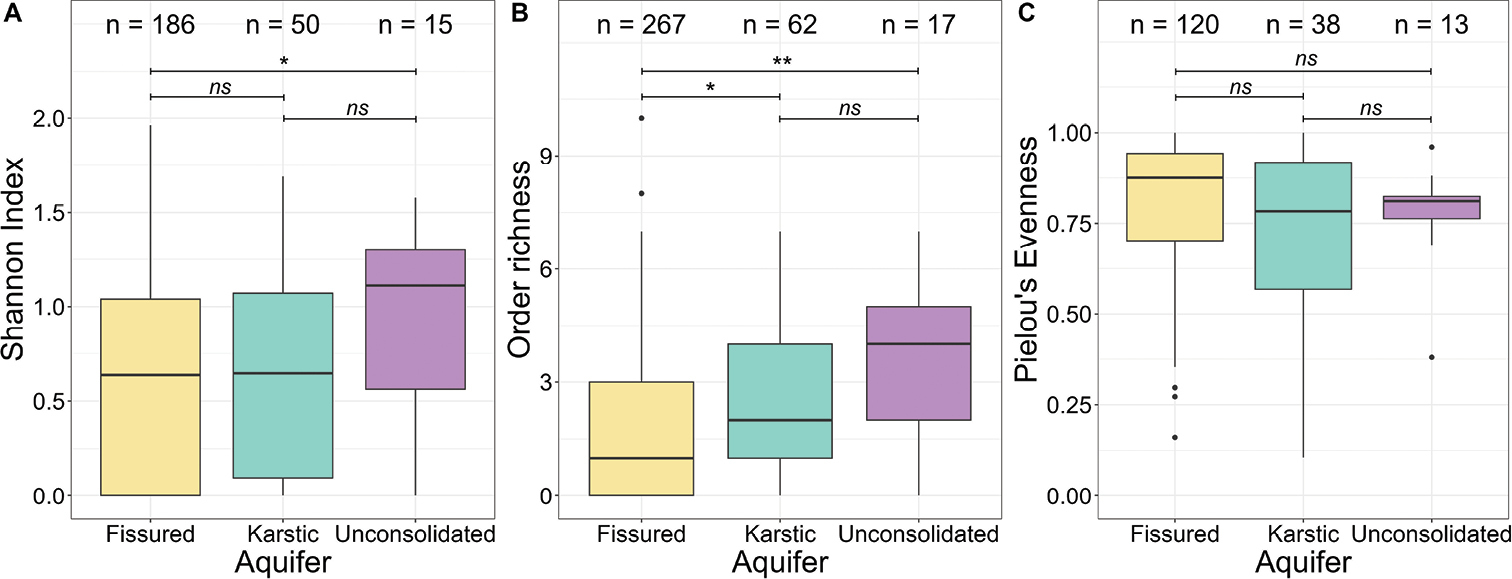
Local macroinvertebrate diversity at the order level per aquifer type A shannon Index (sites with at least one order included) B order richness (number of orders per site, all sites included), and C Pielou’s Evenness (sites with at least two orders included). The thick horizontal lines show the median, the interior of each box represents the interquartile range (IQR) and the vertical lines represent minima and maxima, respectively (1.5 * IQR). The number of sites included for each analysis is shown on top of each boxplot, as well as the significance level between groups (pairwise Wilcoxon rank-sum test with Bonferroni correction, ns for p > 0.05, * for p ≤ 0.05, ** for p ≤ 0.01, *** for p ≤ 0.001). |