|
||
|
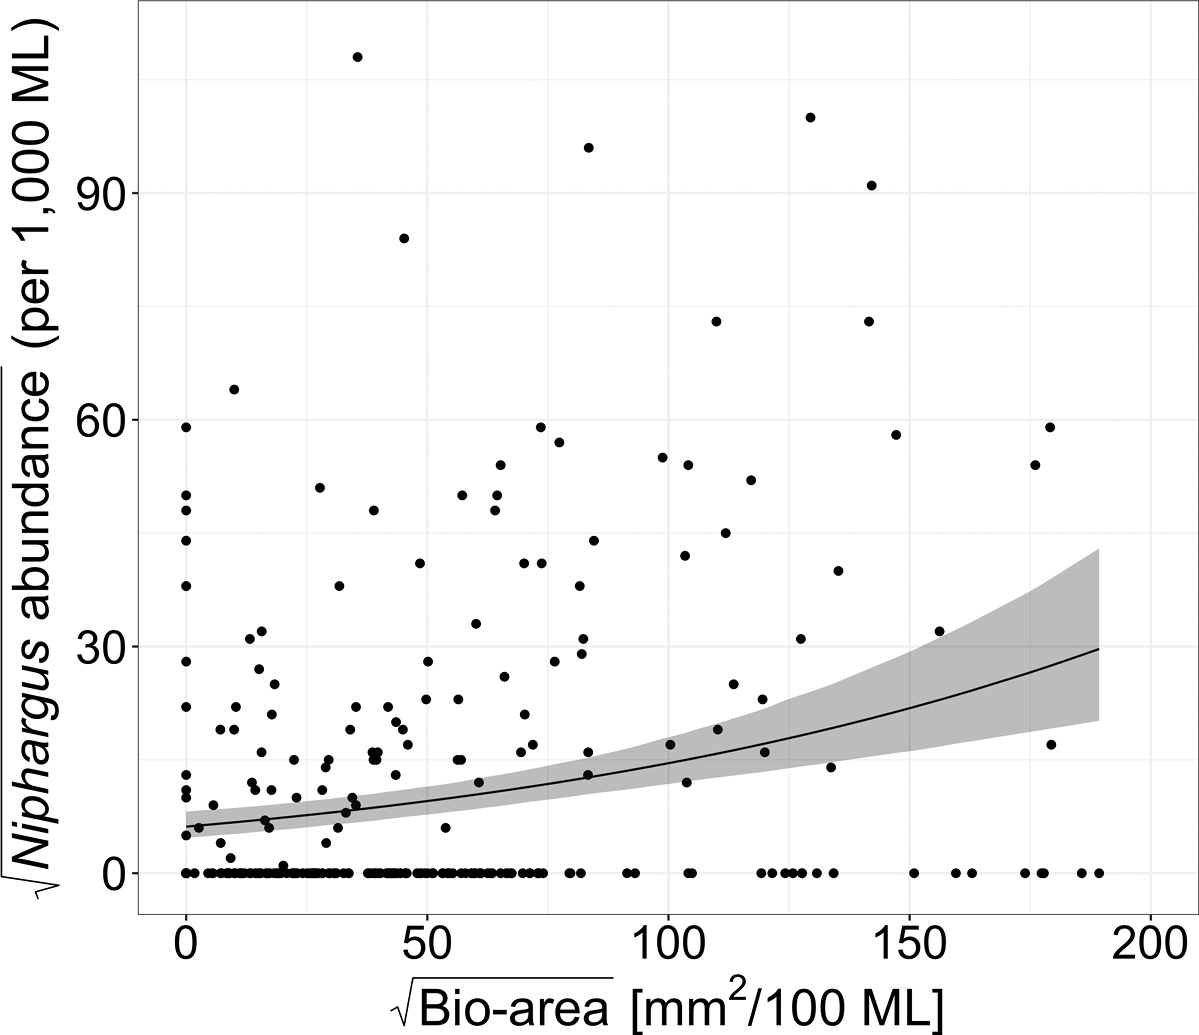
Fit of the ZINB model for Niphargus abundance and the standardized bio-area of other macroinvertebrates. Both variables were square-root-transformed. Bio-area in mm2 per 100 ML discharged groundwater and Niphargus abundance per 1,000 ML discharged groundwater. For visualization, only points with values below 200 (x-axis) and 110 (y-axis) are plotted. The 95% confidence intervals are plotted in grey. |