|
||
|
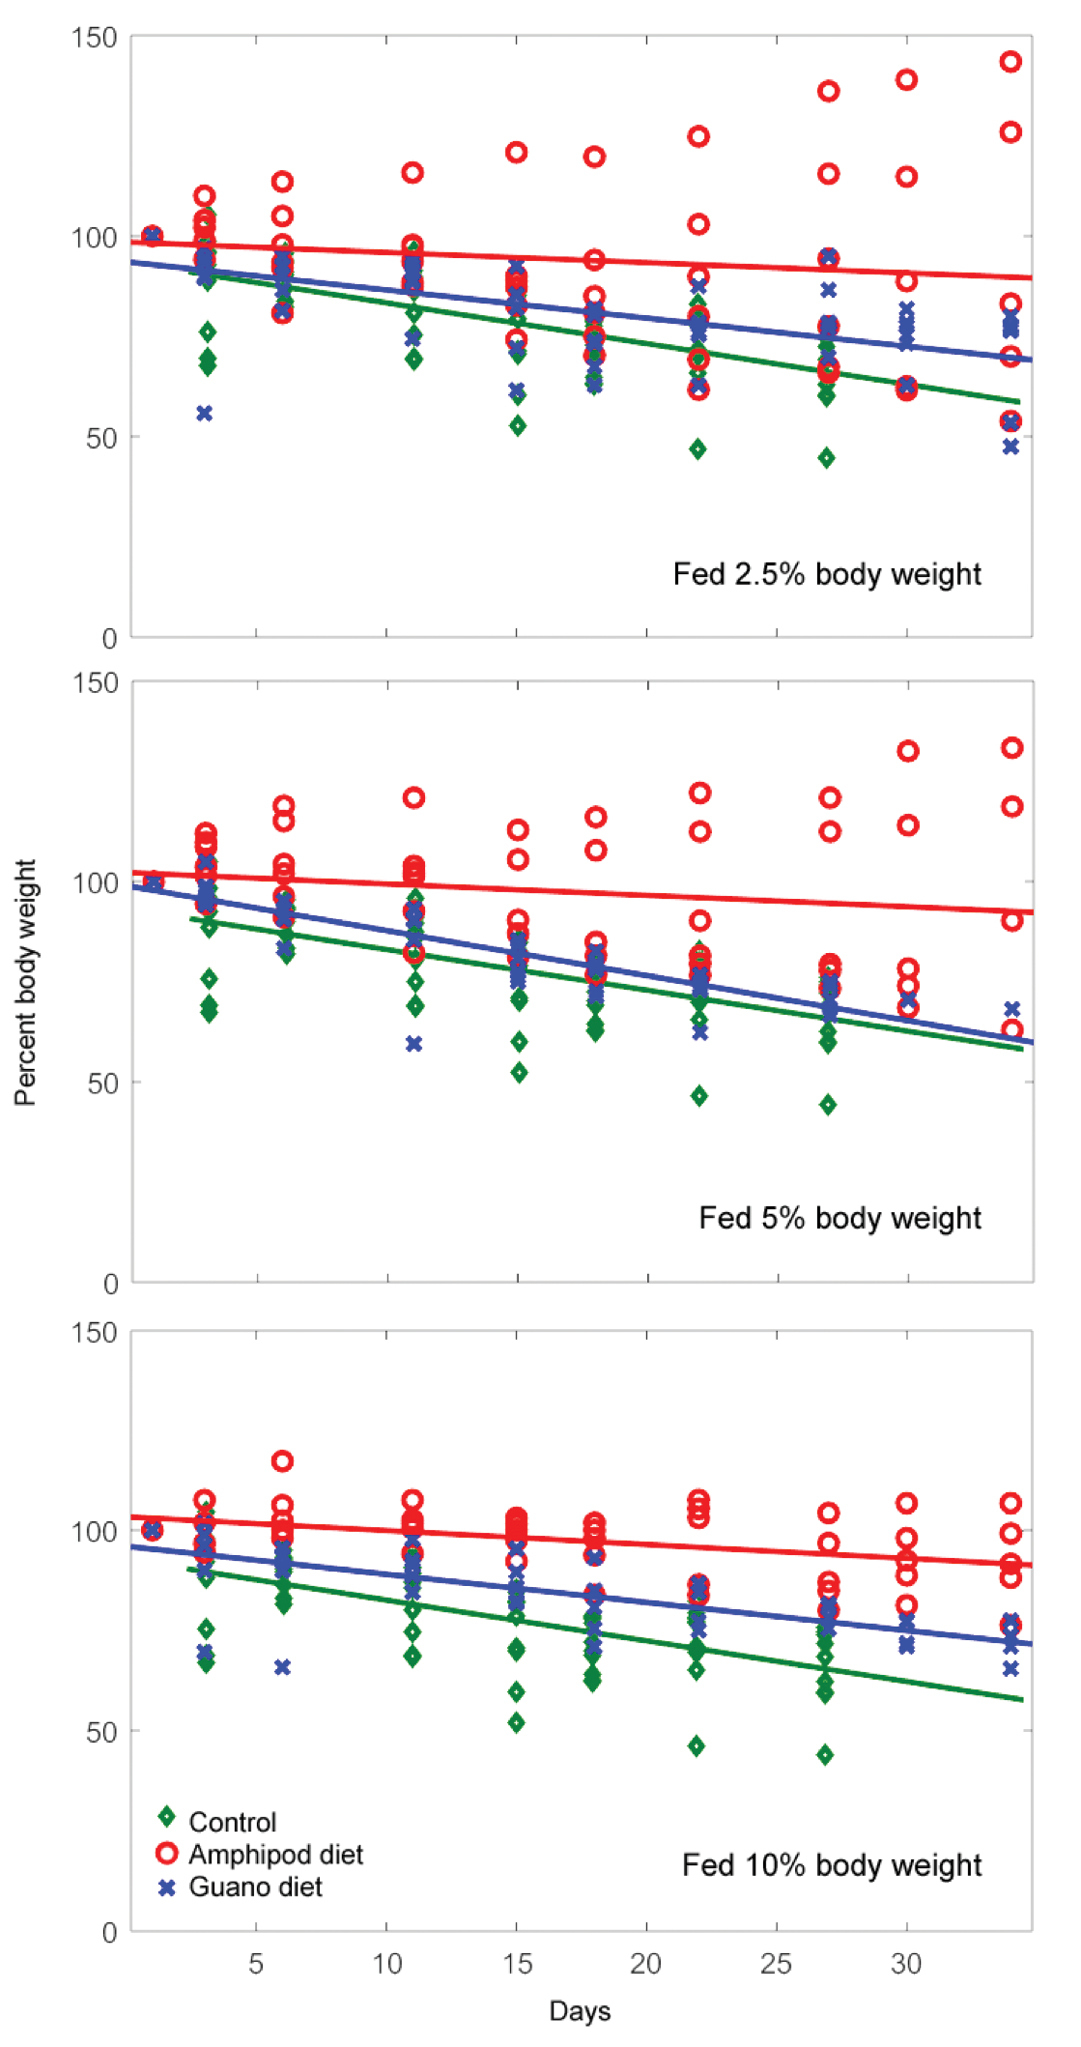
Regression lines based on body mass loss of different diet types and amounts. Salamanders were fed nothing (green), live amphipods (red) or guano (blue). Groups were fed every four days based on their initial body weight, with 2.5% (A), 5% (B) or 10% (C). The calculated regression lines were as follows: Control -1.16x+96.01 R2 = 0.54, n = 10; 2.5%amphipod -0.26x+98.49, R2 = 0.39, n = 6; 2.5%guano -0.70x+93.58, R2 = 0.02, n = 6; 5%amphipod -0.28x+102.22, R2 = 0.03, n = 6; 5%guano -1.12x+98.89, R2 = 0.77, n = 6; 10%amphipod -0.35x+103.36, R2 = 0.21, n = 6; 10%guano -0.70x+96.01, R2 = 0.53, n = 6. |