|
||
|
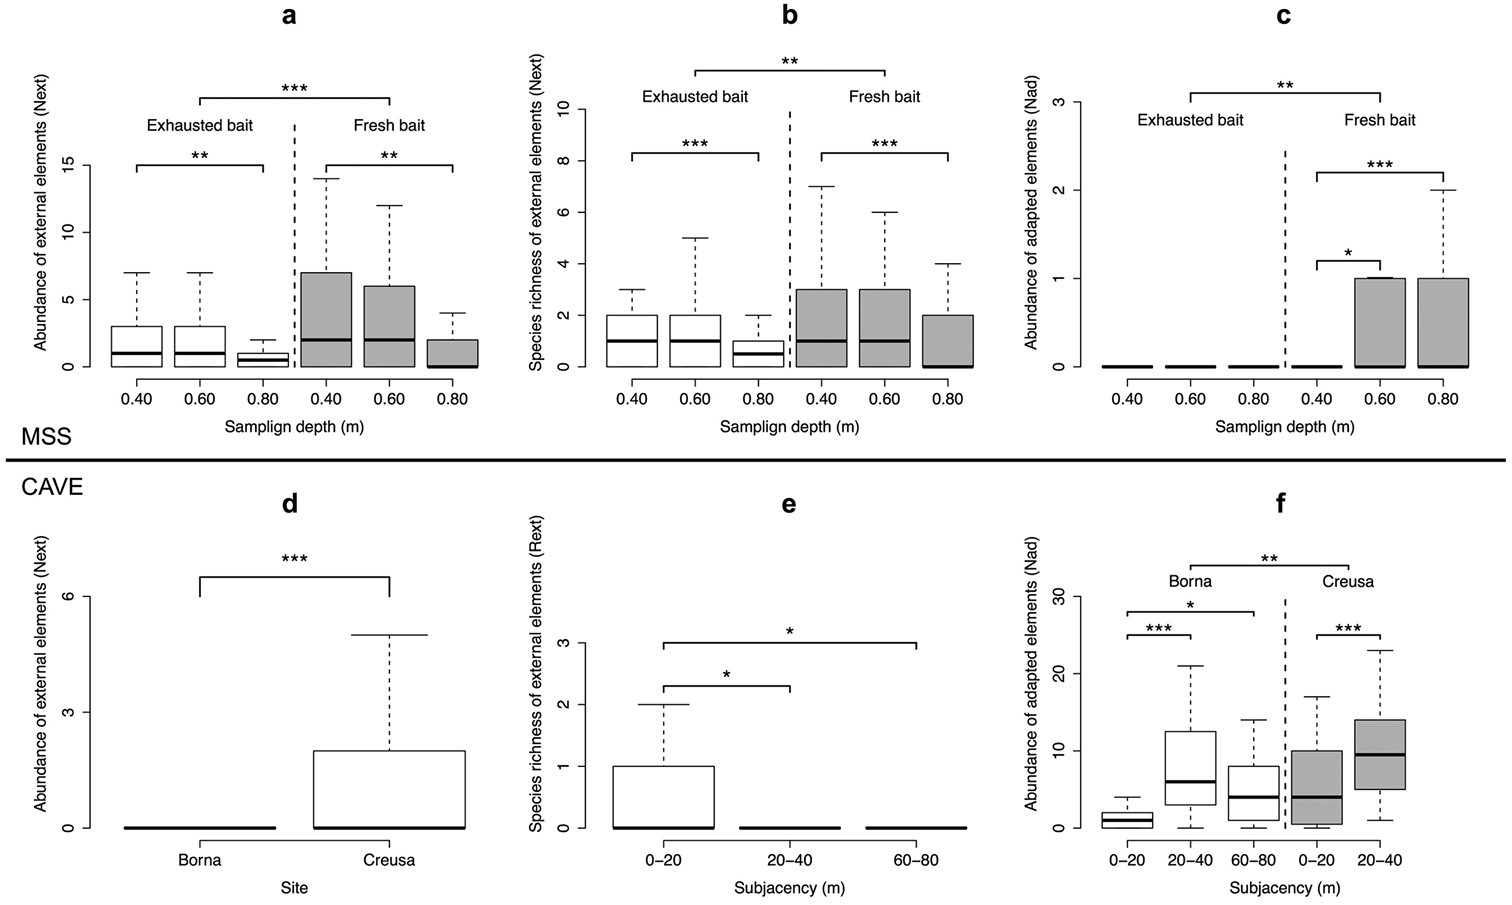
Boxplots showing the results of the regression analysis of the MSS (a–c) and the cave (d–f) data. Outlying values are not shown. Significance codes: < 0.001 ***; < 0.005 **; < 0.05 *. |
|
||||||||
| Part of: Mammola S, Piano E, Giachino PМ, Isaia M (2017) An ecological survey of the invertebrate community at the epigean/hypogean interface. Subterranean Biology 24: 27-52. https://doi.org/10.3897/subtbiol.24.21585 |