|
||
|
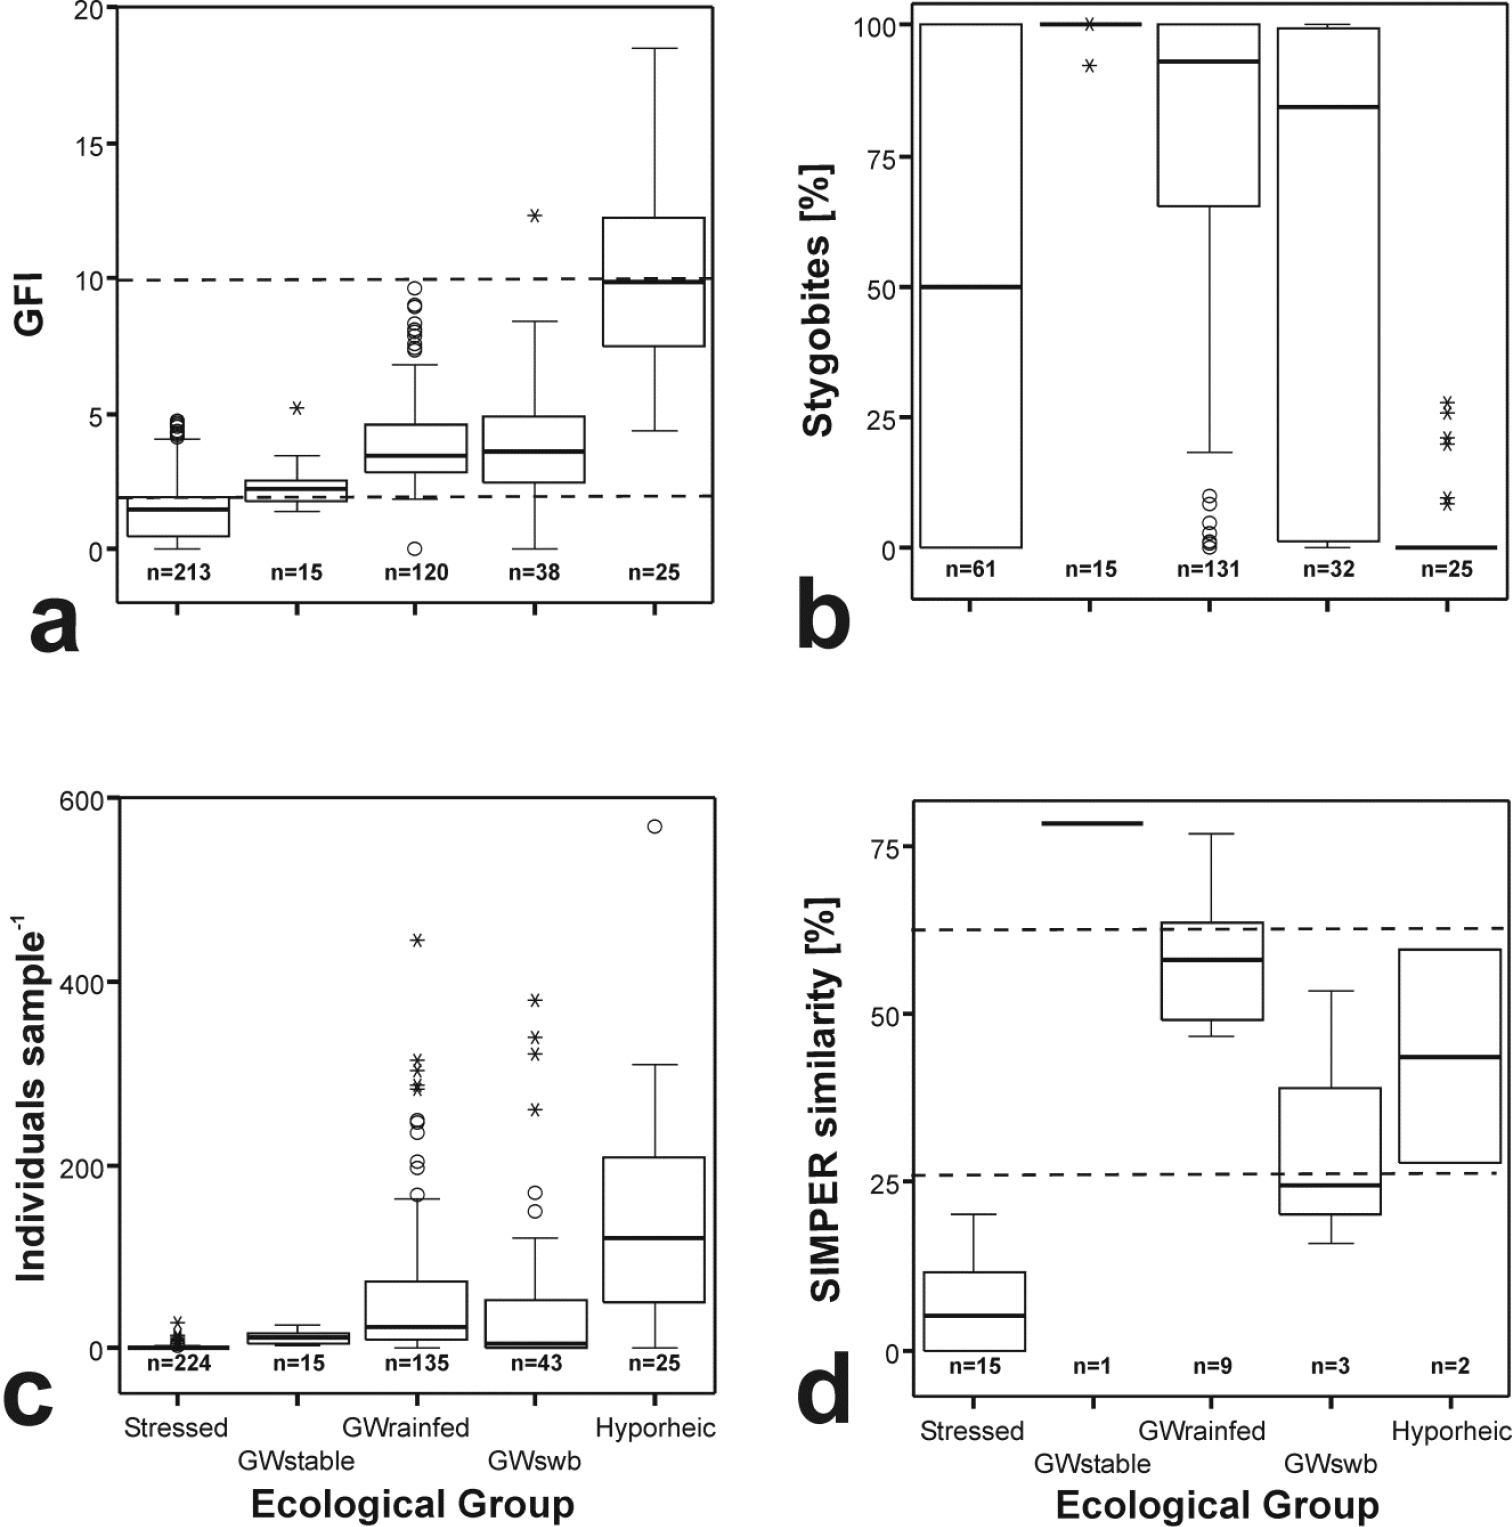
Boxplots on a Groundwater-Fauna-Index-values b percentage of stygobiotic species c Individuals per sample (one outlier omitted each in the groups GWrainfed, GWswb and Hyporheic) and d similarity [%] of faunistic communities in scaled ecological groups. Thresholds for alimony are marked by dashed lines (after Hahn 2006) in Fig. 4a and for faunistic stability (according to Gutjahr et al. 2013a) in Fig. 4d; n = number of samples, box = Interquartile range, vertical black bar = median; whiskers showing the lowest and highest non-outlier; circles showing outliers and stars extreme outliers. |