|
||
|
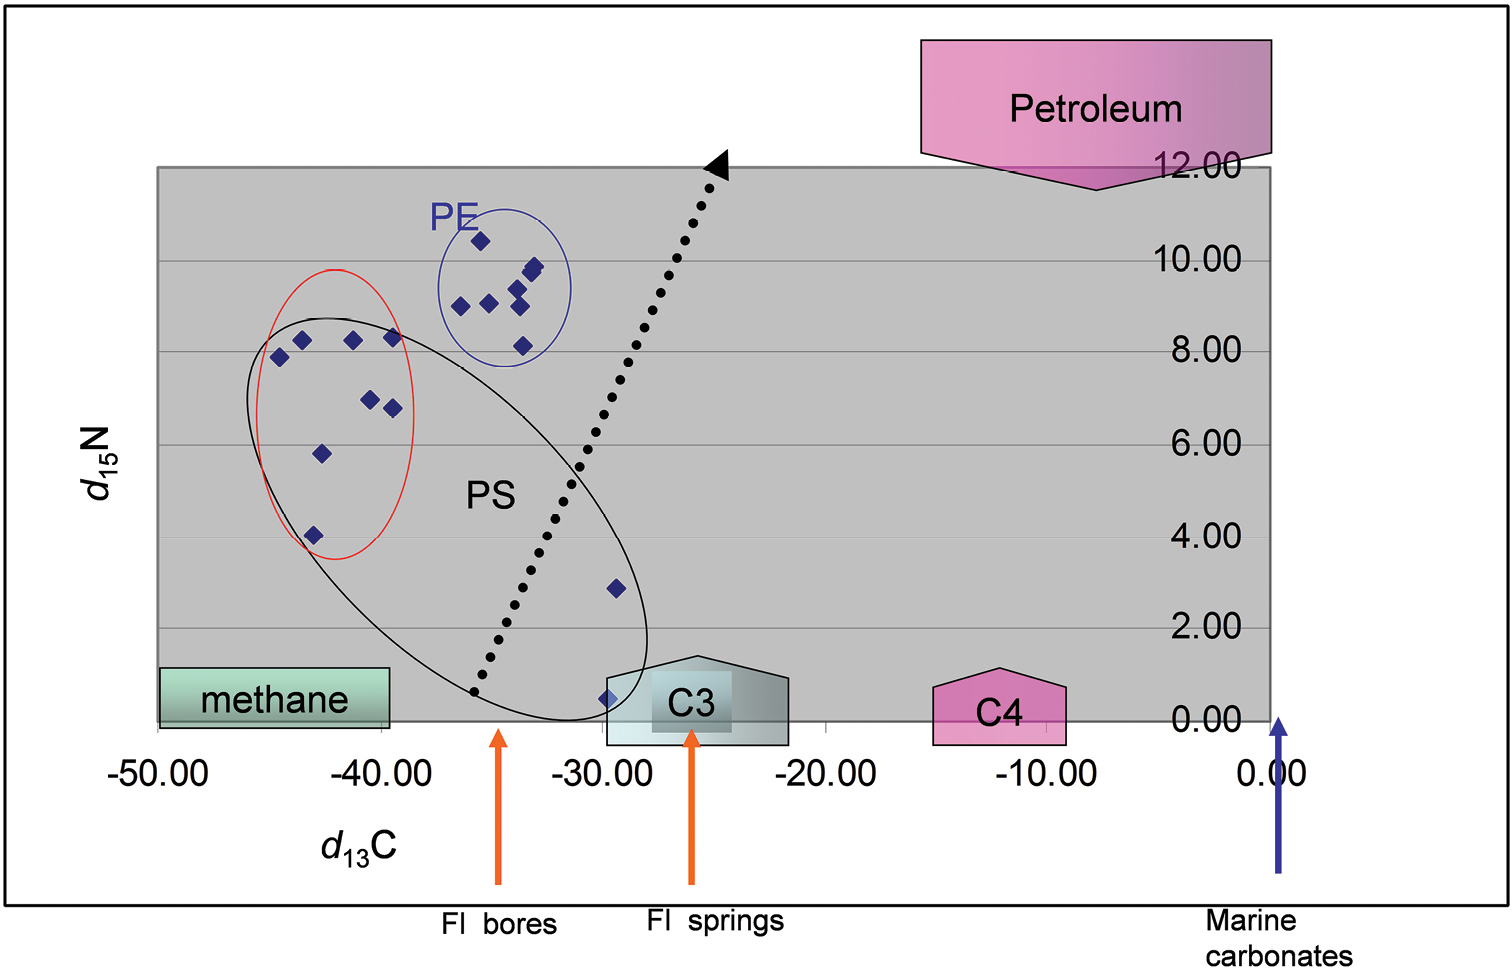
Plot of δ15N on δ13C values for the stygobiont Palaemonetes antrorum (PS, red oval and black oval respectively excluding and including two outliers, see text) and the epigean P. kadiakensis (PE, small blue oval). The range of values of δ13C derived from different energy sources (see text) is indicated (methane, and photosynthesis from C3 and C4 plants) as well as values typical of marine carbonates and petroleum. The diagonal dotted line denotes a typical trajectory (not the value) of amplification of δ15N values with progression through trophic levels (Vanderklift and Ponsard 2003). |