|
||
|
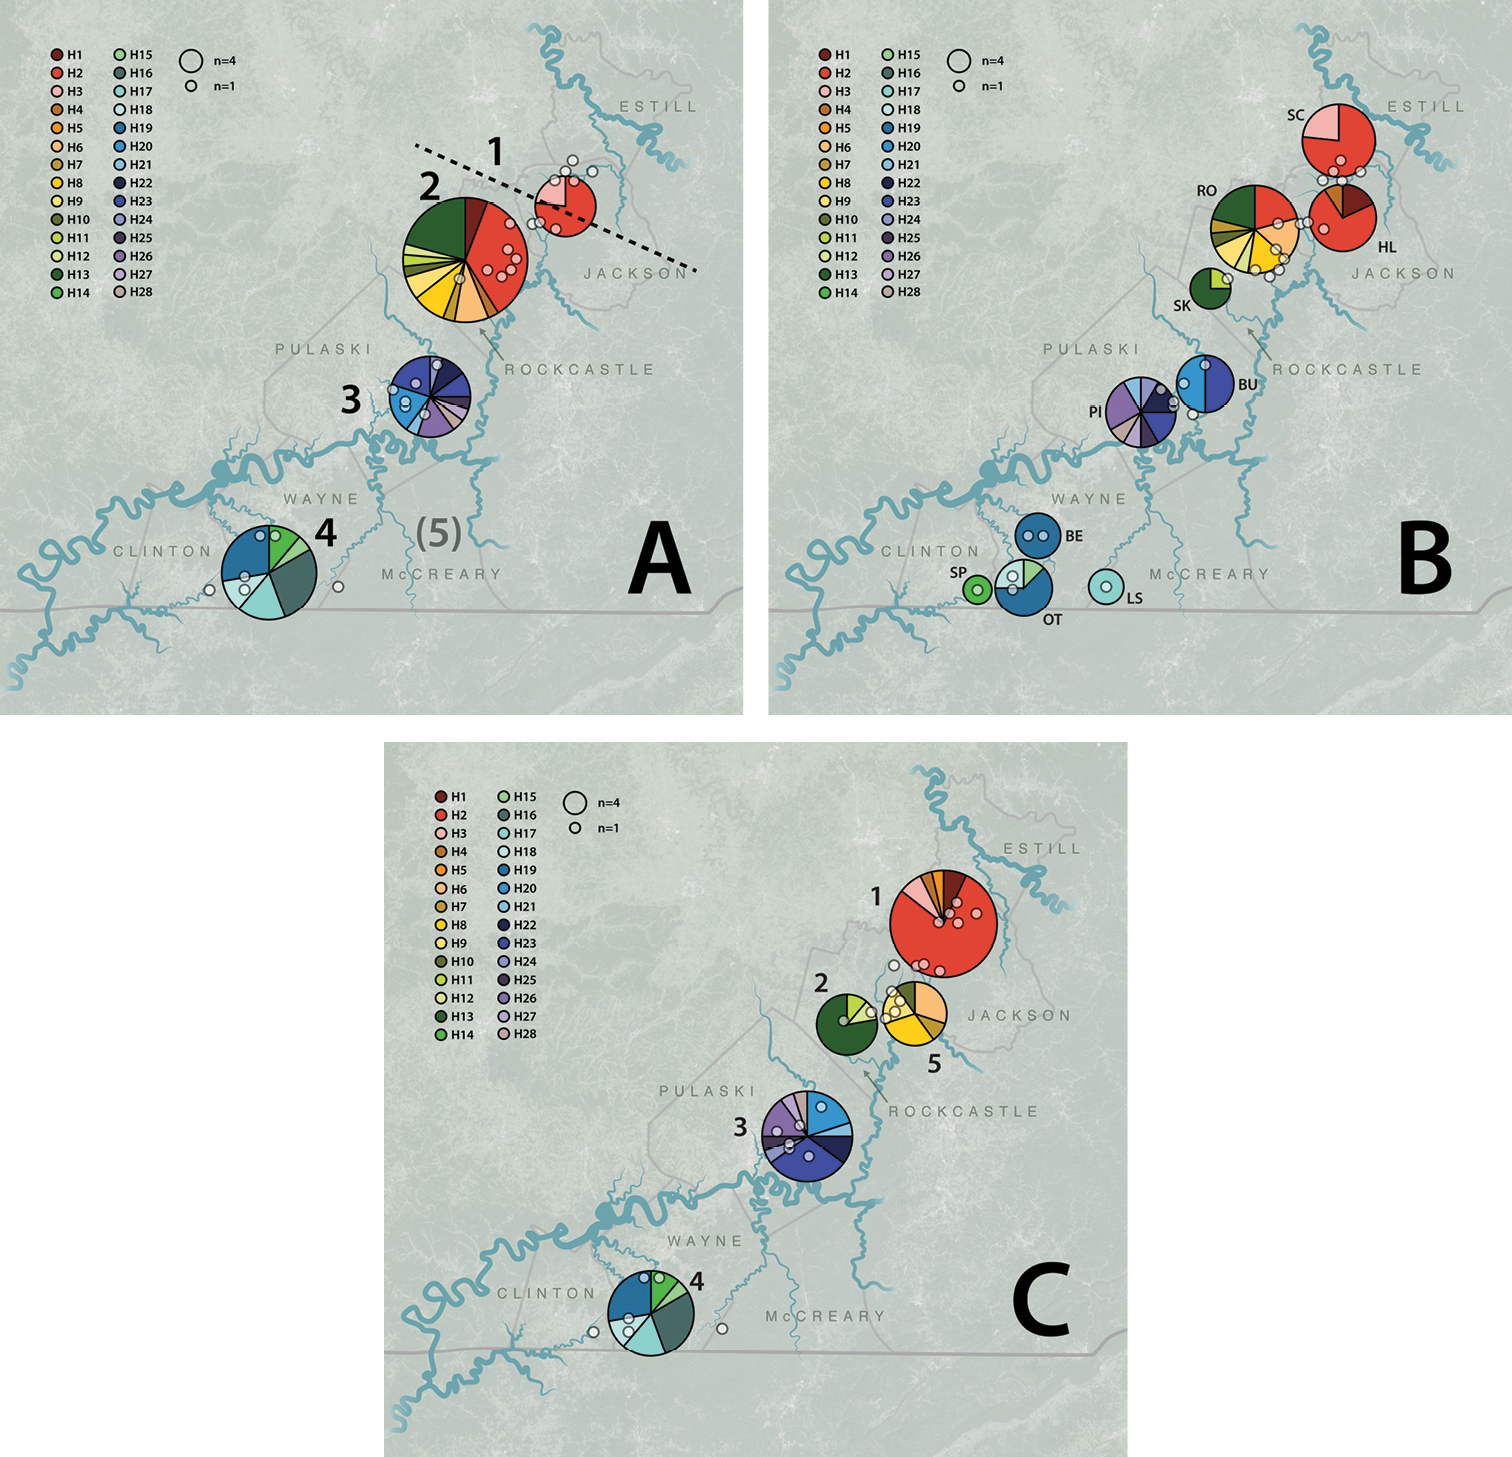
Frequencies of COI haplotypes and their proportions, color coded for each hypothesis of structure; circle area corresponds to number of individuals assigned to each group. Overlain transparent dots show collecting localities. A Four faunal regions of hypothesis I (fifth region unsampled in this study: see discussion and Barr 1985, Kane et al. 1992) B ten minor watersheds of hypothesis II C five genetic clusters of hypothesis III. |