|
||
|
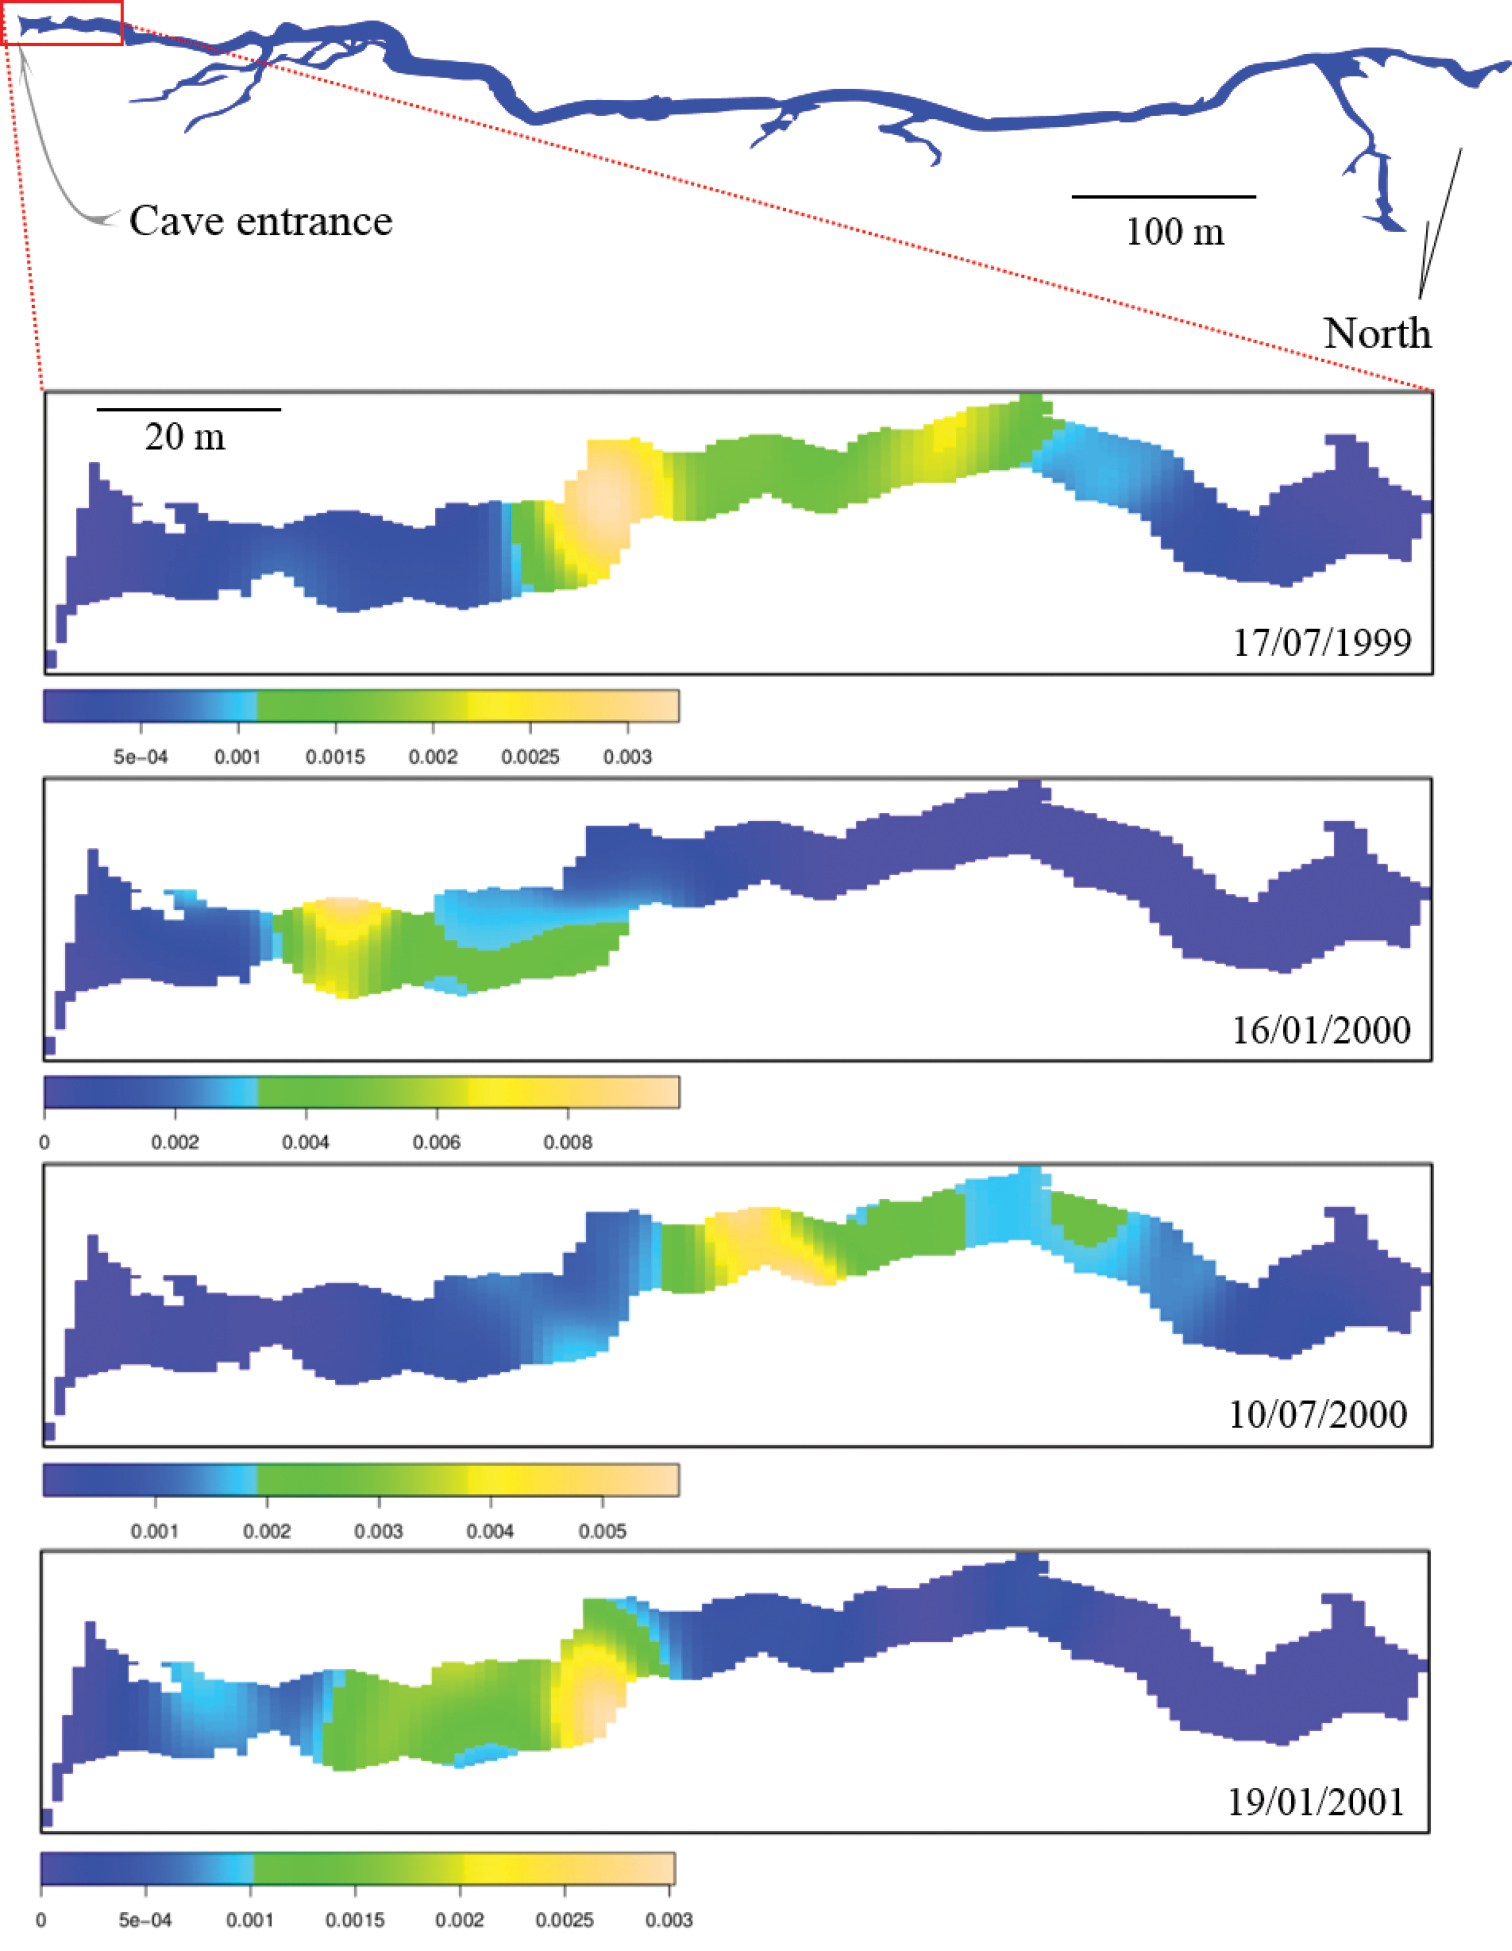
Spatial distribution maps of Hypena sp. demonstrating different densities between seasons. In the dry seasons (17/07/1999 and 10/07/2000) individuals are located in the deepest region of the cave, an opposite pattern during rainy seasons (16/01/2000 and 19/01/2001) when the population of individuals becomes denser in the region near the cave entrance. Blue colors indicate low densities while light yellow colors indicate high densities. |