|
||
|
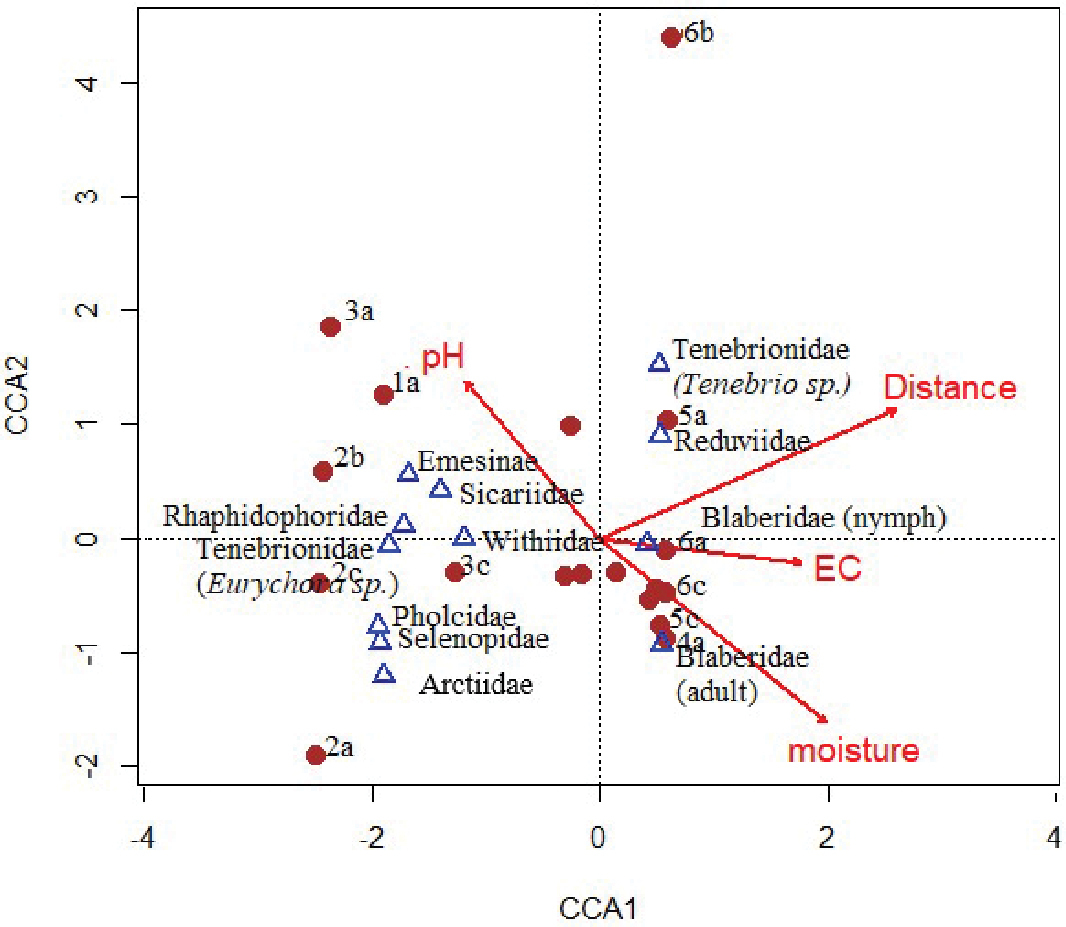
A CCA biplot of the relationships between cave macroinvertebrate taxa (triangles), sampling points (filled circles) and the measured environmental (variables lines with arrows). Environmental variables are presented as vectors, with arrow heads indicating their direction of increase. A positive correlation between the environmental variables and macroinvertebrate taxa and sampling points is indicated by their proximity to the arrowhead. Taxa and sampling points with a negative correlation with the variable axis plot on the opposite side of the arrowhead relative to the centroid, with the correlation strength increasing with distance of the symbols from the centroid. |