|
||
|
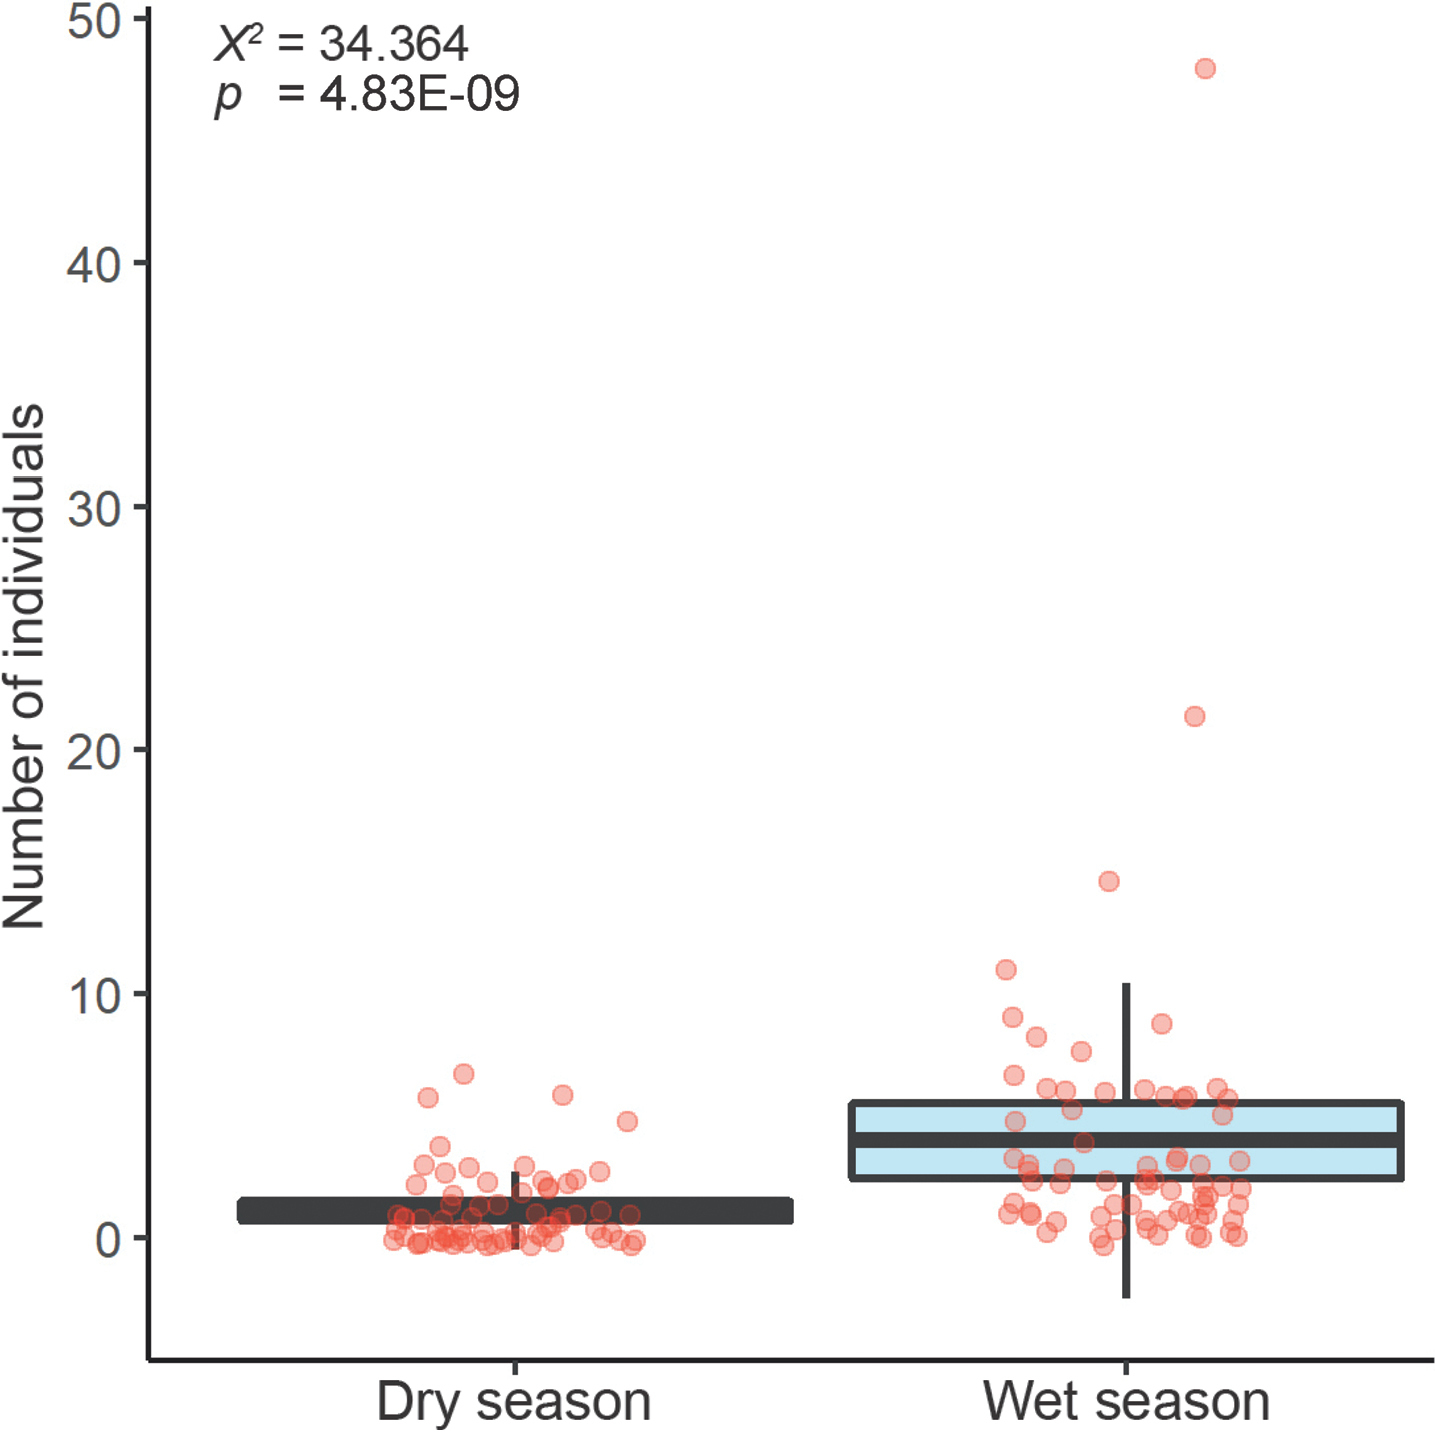
Average sampled individuals of Neocarus simmonsi sp. nov. per cave according to seasonality. The abundance values are significantly different between the two seasons according to the Generalized linear model analysis (z = 5.853; p-value = 4.83e–9) In the boxplots, the turquoise areas refer to the interquartile range around the observed median (central black line) and vertical bars represent the maximum-minimum range (excluding outliers). |