|
||
|
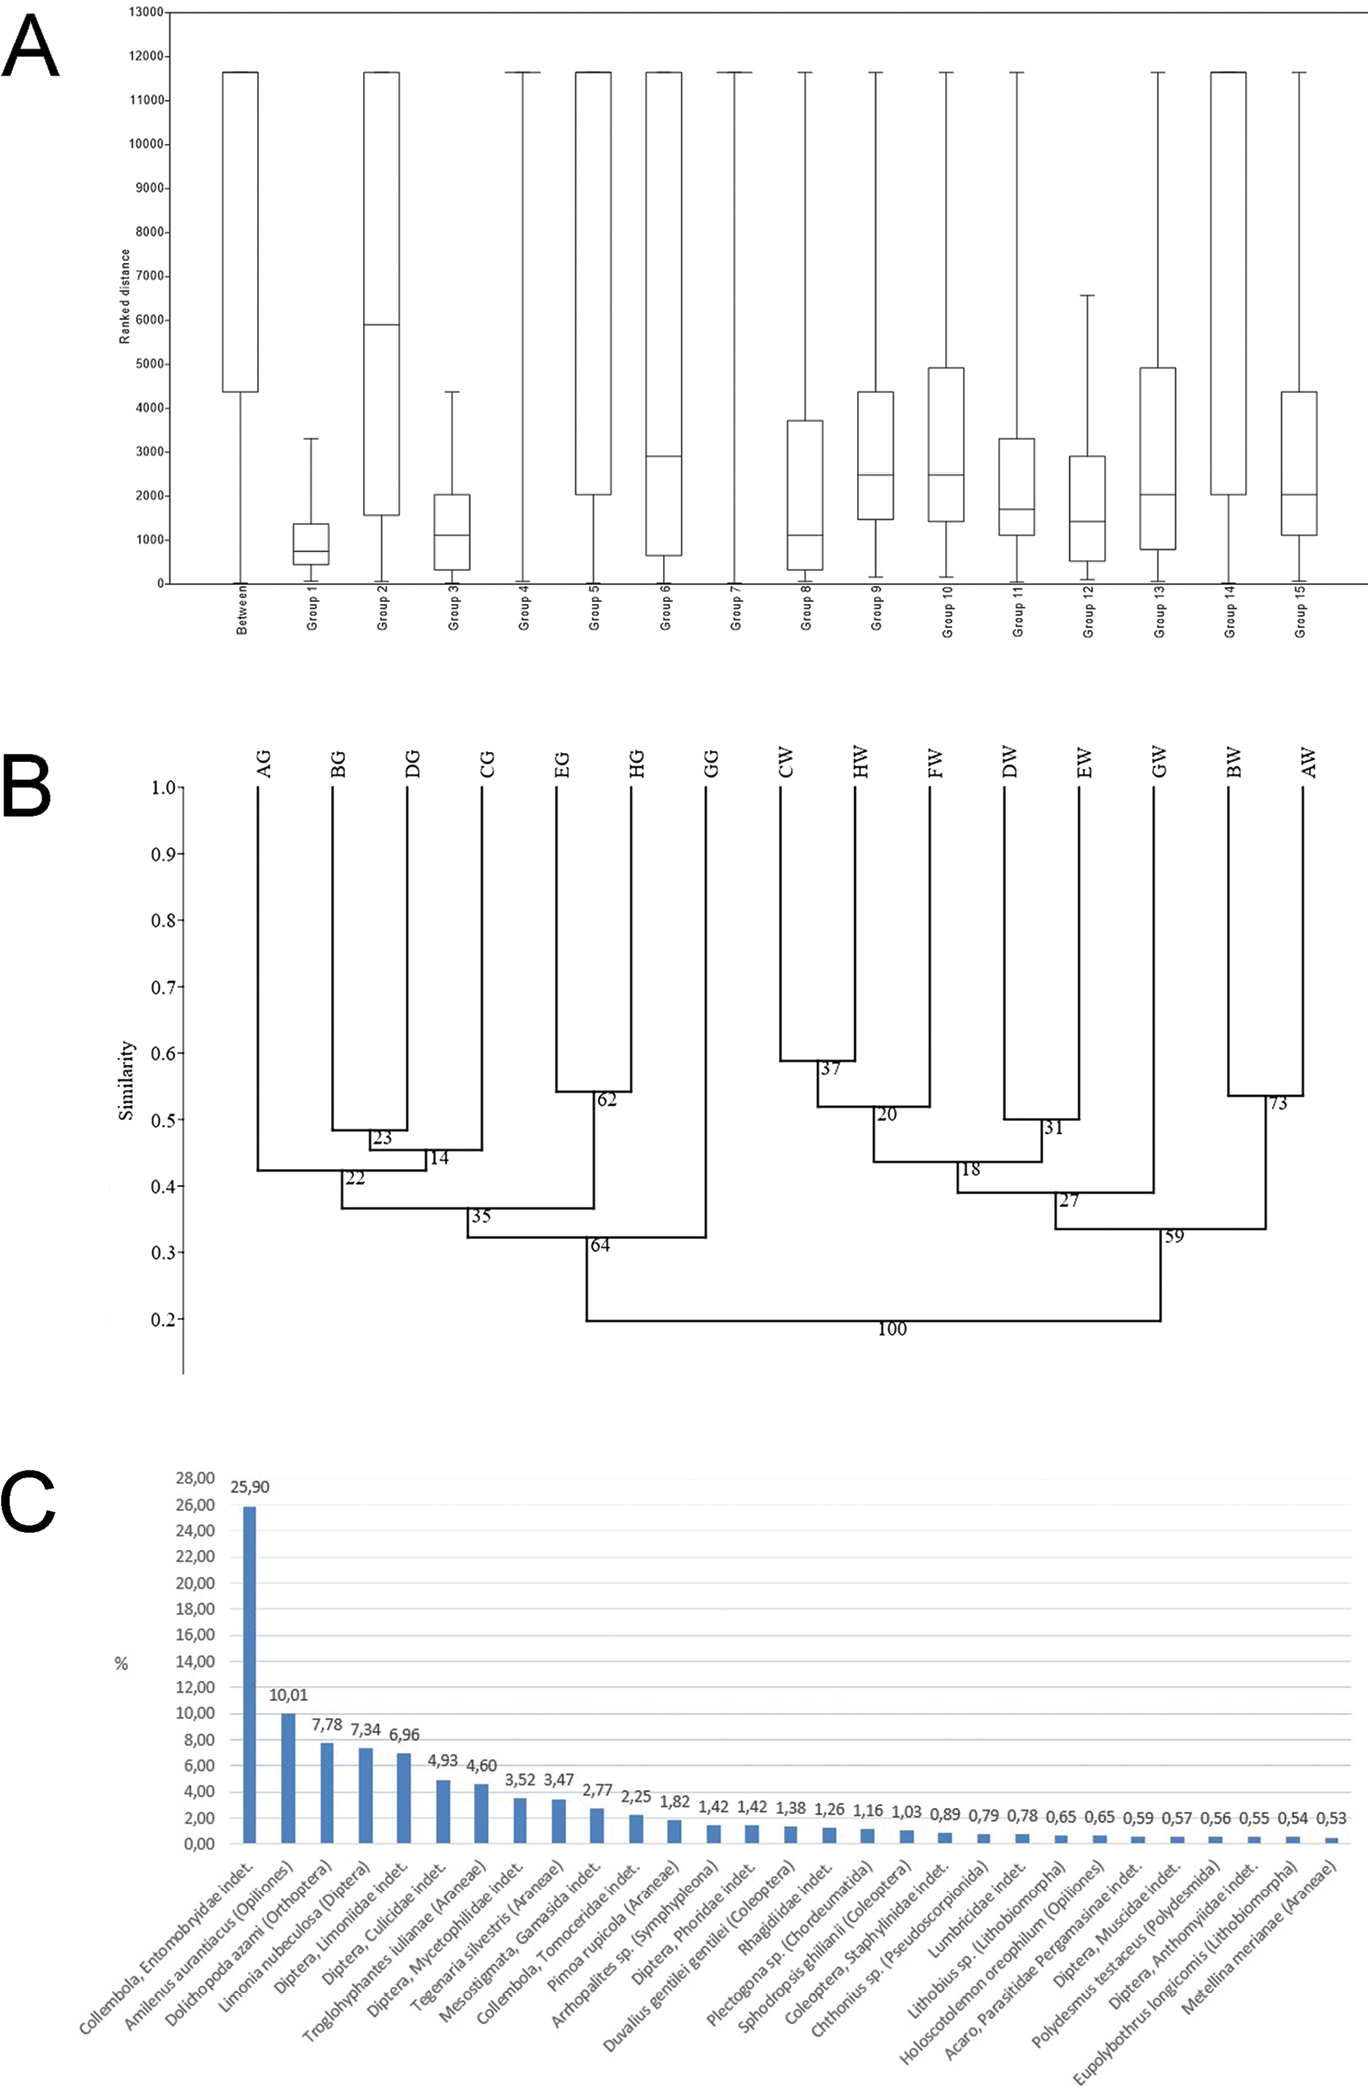
A one-Way ANOSIM test. Wall in eight sites (A-H, Group 1–8), Ground in seven sites (A-E and G-H, Group 9–15) B similarity between ground (from AG to HG) and wall (from AW to HW) faunal samples (UPGMA clustering based on Jaccard similarity index - bootstrap values are shown under each node) C SIMPER Analysis. Taxa responsible for the observed differences between faunal assemblages in different sampling areas in percentage. |