Subterranean Biology 11: 31–44, doi: 10.3897/subtbiol.11.4974
Population size and dispersal patterns for a Drimeotus (Coleoptera, Leiodidae, Leptodirini) cave population
Akos Fejér 1, Oana Teodora Moldovan 2
1 Piaţa Abator 8-9/4, 400137 Cluj Napoca, Romania
2 “Emil Racovitza” Institute of Speleology, Romanian Academy, Clinicilor 5, 400006 Cluj Napoca, Romania

Corresponding author: Oana Teodora Moldovan (oanamol@hasdeu.ubbcluj.ro)

Academic editor: Achille Casale

received 5 March 2013 | accepted 13 June 2013 | Published 12 July 2013


(C) 2013 Akos Fejér. This is an open access article distributed under the terms of the Creative Commons Attribution License 3.0 (CC-BY), which permits unrestricted use, distribution, and reproduction in any medium, provided the original author and source are credited.


For reference, use of the paginated PDF or printed version of this article is recommended.

Abstract

Drimeotus viehmanni (Coleoptera, Leiodidae) is abundant in the cave Peştera cu Apă din Valea Leşului (Western Carpathians) and was chosen for a mark-release-resight experiment. The aims of the experiment were to estimate the size of the population and to analyze the dispersal patterns inside the cave, for conservation purposes. During the three years’ study, the observed abundance of Drimeotus viehmanni was significantly higher in summer compared to the winter season. The seasonal dynamics can not be explained by climate features such as temperature and air relative humidity which had low or no variation during all seasons. Few marked beetles were re-seen during the mark-resight experiment proving the existence of an important cave/subterranean population, which was estimated between 5, 084 and 533, 033 individuals. The marked individuals moved between neighbouring patches on a distance of 10 m over the same amount of time as on distances longer than 200 m. Dispersal inside the cave occurs during the winter months, which indicates non-continuous behaviour triggered by environmental features and involving only a negligible part of the population in the studied cave.

Keywords

Cave beetles, population dynamics, mark-resight, migration, cave climate, Carpathians, Romania

Introduction

Estimation and prediction of population sizes have been a challenge and a must of many ecological studies (Freckleton et al. 2006). There have been some endeavours to determine population growth, density regulation, and environmental variability (Hovestadt and Nowicki 2008). Moreover, in a world dominated by the need to protect vulnerable species (Crandall et al. 1999), the estimation of the population/species abundance became an important step towards the correct assessment of the need for rare species conservation.

Although the total number of cave species has been estimated to 50, 000-100, 000 (Culver and Holsinger 1992), few studies deal with estimations of cave populations and few mark-recapture experiments have been undertaken until present (Cabidoche 1966, Keith 1975, Peck 1975, Delay 1978, Hobbs 1978, Racovitza 1980, Hobbs 1981, Carchini et al. 1982, Tercafs and Brouwir 1991, Rusdea 1992, Carchini et al. 1994, Bernardini et al. 1996, Simon 1997, Knapp and Fong 1999, Willemart and Gnaspini 2004, Cooper and Cooper 2009, Venarsky et al. 2012). The aims of these studies were to census subterranean populations and to date the longevity of cave species. In most of them, seasonal variability has been documented and different explanations were proposed.

The use of the mark-recapture methods to evaluate subterranean beetle populations is problematic due to the difficult access to populations, and both long life and low reproduction rates of their representatives (Delay 1978). The estimated population of Aphaenops loubensis Jeannel, 1953 in one station of the Pierre-Saint Martin system (France) was of 100 to 400 individuals (Cabidoche 1966, Delay 1978). Speonomus infernus (Dieck, 1869) from theSaint Catherine Cave (France) has been estimated in one of the cave chambers at 300 individuals (Juberthie 1969, Delay 1978). Delay (1978) estimated the population of Speonomus longicornis (Saulcy, 1872) fromthe Pigailh Cave (France) at 50, 000 individuals. In Romania, the number of Pholeuon proserpinae glaciale Jeannel, 1923 in the Scărişoara Ice Cave was estimated at 33, 000 individuals (Racovitza 1980).

The aim of our study was to analyse the patterns of distribution for a beetle population inside one cave and in correlation to topoclimate variations, and to estimate the cave population size by using the mark-resight method. The results on both population size and dispersal behaviour of a subterranean beetle population are the starting point in further studies about the impact of the touristic infrastructure on cave inhabitants.

We chose Drimetous s. str. viehmanni (Ienistea, 1955) (Coleoptera, Leiodidae, Leptodirini) from the cave Peştera cu Apă din Valea Leşului for the mark-resight experiment. Drimeotus s. str. endemic for the Pădurea Craiului Mountains (North-Western Romania) is represented by 14 species most of them endemic for one cave system or a complex of caves in one valley (Moldovan 2000). Drimeotus viehmanni is abundant inside the cave Peştera cu Apă din Valea Leşului all year round, with variations from summer to winter months (Racoviţă and Şerban 1975). Previous researches found no correlation between population dynamics and the cave climate.

Methods and materials
Research protocol

The study on the cave population of Drimeotus viehmanni was carried out in the Peştera cu Apă din Valea Leşului, between March 2005 and November 2007, with a total of 25 visits in the cave. The time lap between two visits was no longer than one and a half month, with one exception during autumn 2006.

The Peştera cu Apă din Valea Leşului is located in the eastern part of the Western Carpathians (North-Western Romania) at an altitude of 700 m a.s.l. The cave has one main gallery in total length of 1265 m (Cocean 1995), with a permanent subterranean stream. Five stations (I –V) were established inside the cave (Fig. 1). The first station was located 160 meters from the entrance inside the cave and the others at distances between 385 and 420 meters inside the cave. They consist of a bait (salami) placed directly on the substrate and fixed with a rock, as described in other studies (Cabidoche 1966, Juberthie 1969, Delay 1978, Racovitza 1980). The number of the individuals present at each station has been counted monthly and the bait has been replaced at every counting time.

Figure 1.

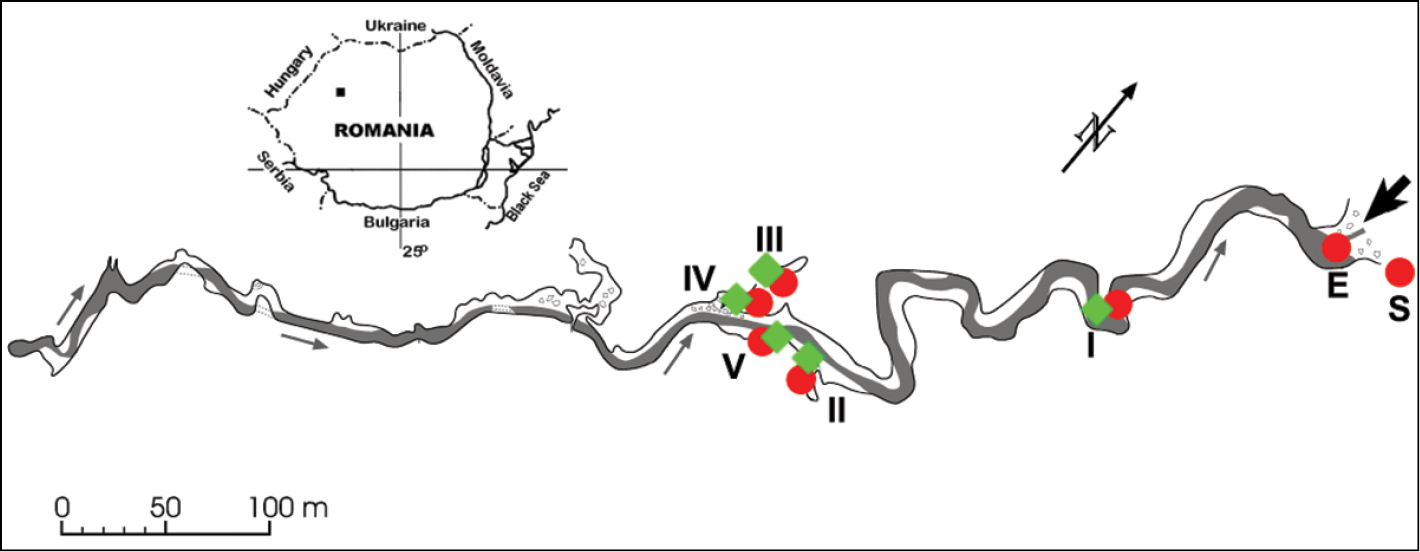
Peştera cu Apă din Valea Leşului (modified after Cocean 1995), with the position of the cave in Romania and the sites for climatic measurements (red) and fauna counting (green): I-V stations; S = surface; E = entrance.

The cave microclimate is typical for a horizontal cave with one entrance; two different air flow systems, caused by temperature differences between cave and surface, are influencing the winter and the summer cave climate (Racoviţă and Cocean 1977). The air temperature and the air relative humidity were measured in front of the cave (S), at the cave entrance (E) and in every station (I-V) (Fig. 1) at each visit. An Assmann type psychrometer was used for both the air temperature and relative air humidity measurements. The data have been transformed using an online converter (http://www.bom.gov.au/lam/humiditycalc.shtml ).

Population size estimation

A mark-release-resight method was used for the estimation of the population abundance (N). During the first counting, every individual elytra was marked with non-toxic paint (as described in Delay 1978). The estimated population size was estimated using the Lincoln-Peterson index, which has high variability and considerably high error. To reduce this tendency to overestimate, Bailey (1951, 1952) proposed a corrected formula:

N = M (n + 1) / m + 1

where: N = the actual size of the study population, M = the number of individuals marked and released, m = the number of marked individuals in a sample of the population, n = the total number of individuals in the sample.

The mark-resight method is different from the traditional mark-recapture methods, in that it includes data on encounters of marked individuals and of the unmarked individuals. Individuals are marked prior to sampling which consists of sighting surveys instead of capture periods. The main advantage of this approach is that it is less invasive than the traditional mark-recapture (McClintock and White 2009).

328 individuals were marked the first time and 1065 individuals the second time. The individuals were marked in March 2005 at station II and in July 2005 at station III. Two different colours have been used, as follows: yellow at station II and blue at station III. The two points are on the opposite banks of the subterranean stream.

Statistical analyses

Non-parametric tests, Kruskal-Wallis (KW) and Mann-Whitney (MW), were used for the seasonal analysis of the air temperature, the relative air humidity and the number of individuals. All analyses were conducted using R 2.10.1. statistical software (R Development Core Team 2009).

Results
Seasonal dynamics

The amplitude of the air temperature in the Peştera cu Apă din Valea Leşului decreases inwards the cave, from 10.5°C at the surface to 8.3°C at station V (both are mean values for the period October 2006-November 2007). The temperature inside the cave (stations I-V) had no significant seasonal variation. There is no significant difference between the five cave stations (MW = 361, p = 0.13) in terms of air temperatures by comparing the winter months (December, January and February) to the summer months (June, July, August) (Fig. 2). The air relative humidity has larger variations outside the cave and at the entrance, while inside higher values were measured in all seasons (Fig. 3). The air relative humidity varied seasonally in all stations and there is a significant difference between data recorded at the five stations inside the cave (KW: chi2 = 10.5, df = 4, p = 0.03).

Figure 2.

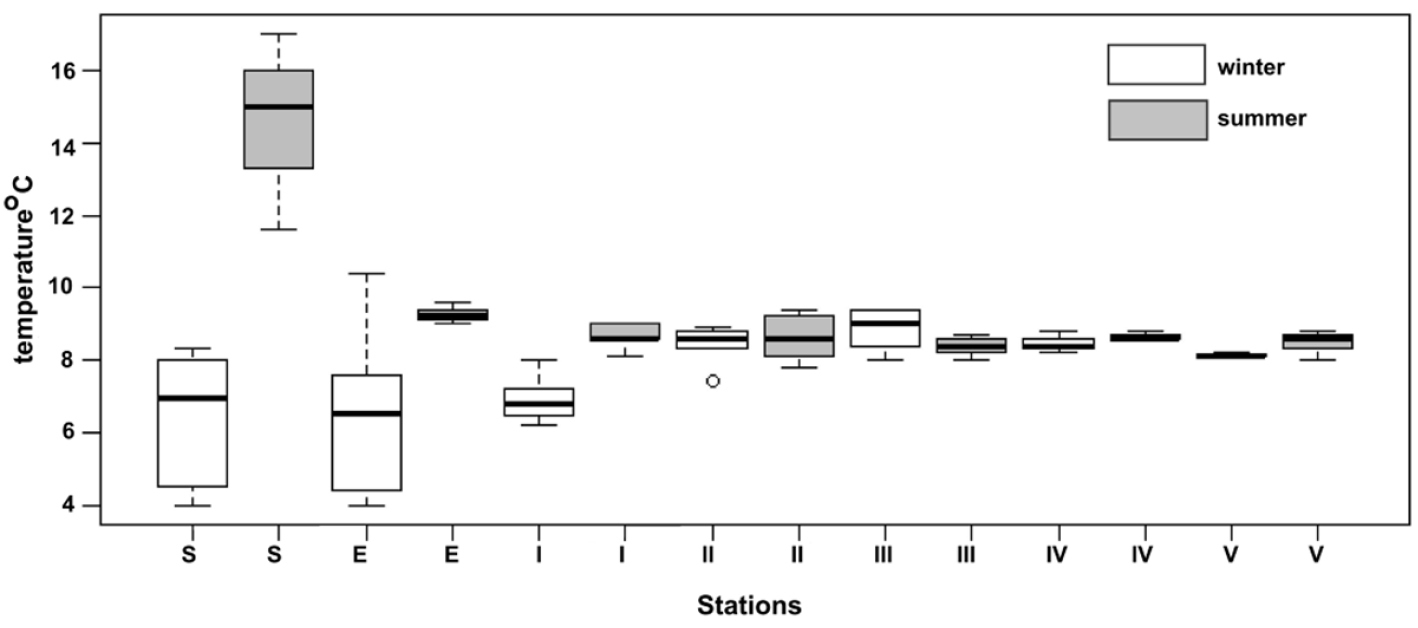
Box-plot of the air temperature, during winter and summer months, at the surface (S), the entrance (E) and the five stations (I-V) for Peştera cu Apă din Valea Leşului.

Figure 3.

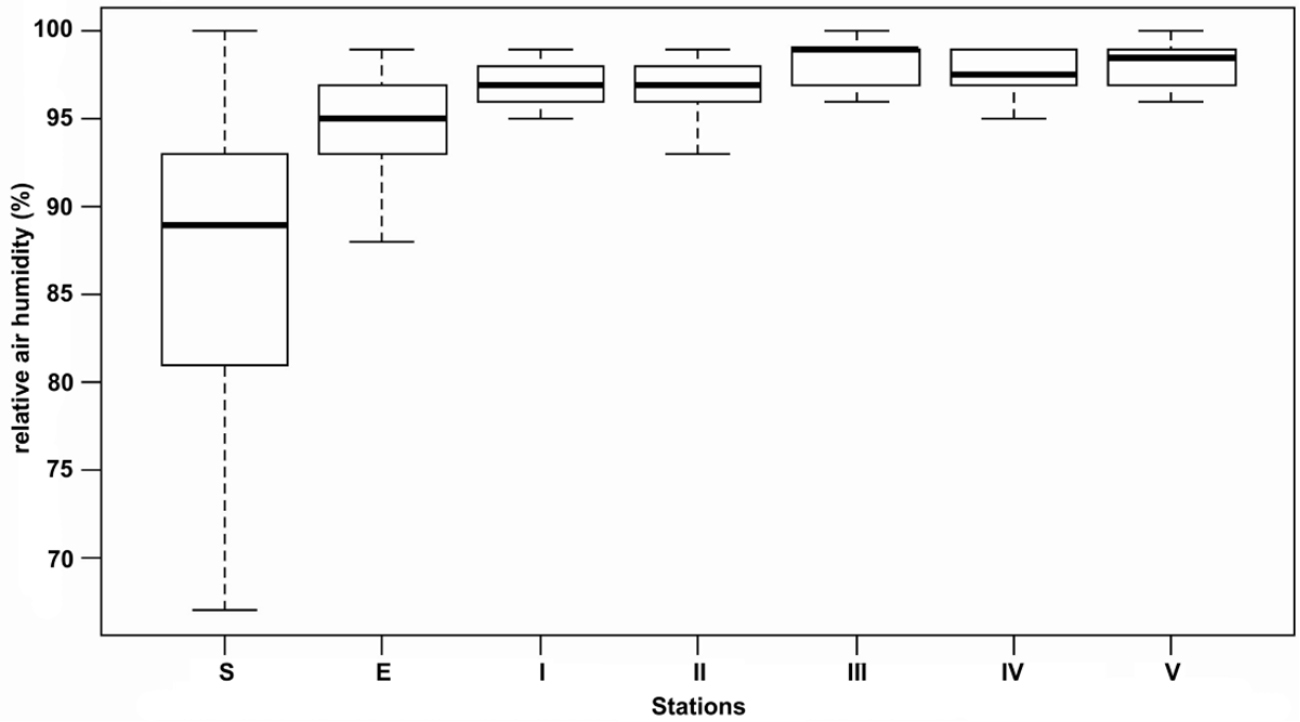
Box-plot of the relative air humidity at the surface (S), the entrance (E) and the five stations (I–V) for Peştera cu Apă din Valea Leşului.

During the study, the highest abundances of Drimeotus viehmanni were recorded at stations II and III (Fig. 4, Table 1). At station II, most individuals were counted in September 2007 (3, 000 individuals), and there were only three occasions when the number of beetles was under 100 (November 2005, October 2006 and November 2007). At station III, the highest number of individuals was counted in June 2006 (1, 700 individuals). In this station there were more than ten occasions when the total number of individuals was lower than 100, especially during the autumn-winter months. A reduced number of beetles was recorded at station I, the closest to the entrance. Here, the maximum number was 65, and on five occasions Drimeotus viehmanni was absent. The stations IV and V were added later in our study and they had similar seasonal dynamics with a drastic increase in the number of individuals during the summer months (Fig. 4).

Figure 4.

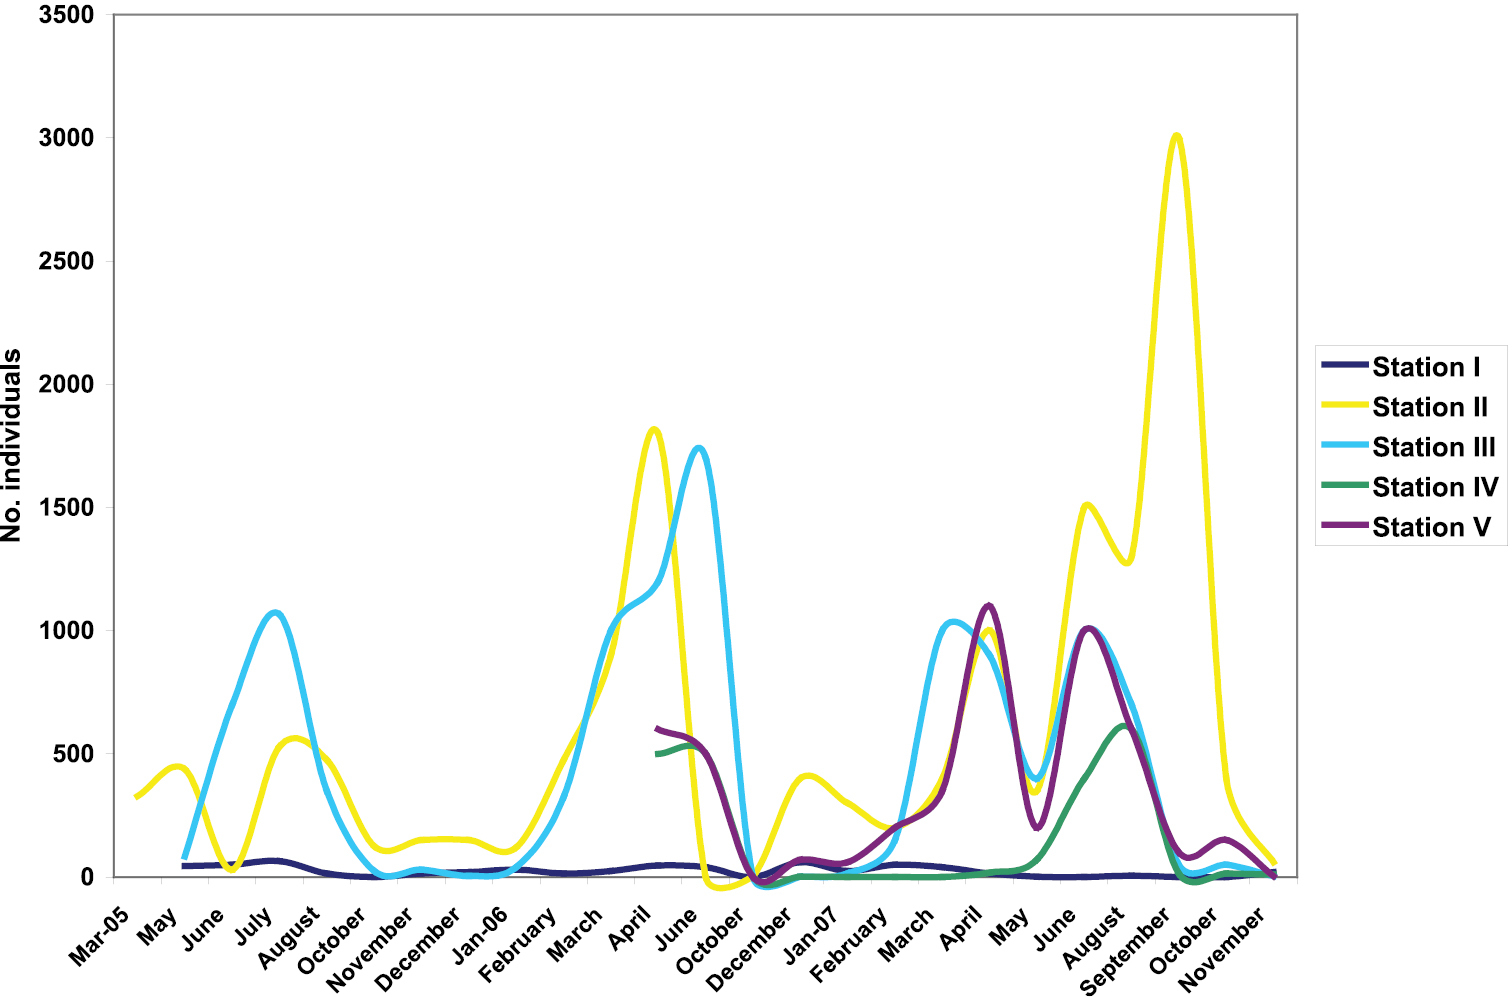
Monthly variation of the number of individuals of Drimeotus viehmanni in the five stations (I–V) of Peştera cu Apă din Valea Leşului.

Table 1.

Total number and number of marked individuals of Drimeotus viehmanni from Peştera cu Apă din Valea Leşului, during the period March 2005 – November 2007.

Month Station I Station II Station III Station IV Station V
Total Marked Total Marked Total Marked Total Marked Total Marked
Mar-05 328 328
May 45 - 437 12 83 -
June 50 - 30 1 700 -
July 65 - 530 10 1065 1065
August 15 - 475 3 350 9
October 0 - 125 - 25 1
November 15 - 150 - 30 -
December 20 - 150 - 5 -
Jan-06 30 - 120 - 40 2
February 15 - 475 2 325 1
March 25 - 900 1 1000 1
April 47 - 1800 - 1200 2 500 1 600 -
June 40 - 0 - 1700 - 500 - 500 -
October 0 - 4 - 1 - 1 - 0 -
December 60 1 400 - 1 - 1 - 70 -
Jan-07 25 1 300 - 15 1 0 - 60 -
February 50 - 200 - 150 - 0 - 200 -
March 40 - 400 - 1000 - 0 - 350 -
April 15 - 1000 - 900 - 18 - 1100 -
May 1 - 350 - 400 - 70 - 200 -
June 0 - 1500 - 1000 - 400 1 1000 -
August 6 - 1300 - 700 - 600 - 600 -
September 0 - 3000 - 50 - 15 - 100 -
October 0 - 400 - 50 - 15 - 150 -
November 20 - 60 - 3 - 10 - 3 -

When comparing the number of individuals, a significant difference between the five stations (KW: chi2 = 30.2, df = 4, p < 0.001) can be noticed (Fig. 5). Because station I had a low number of beetles, we compared only the other four stations, but the difference remained significant (KW: chi2 = 8.9, df = 3, p = 0.03).

Figure 5.

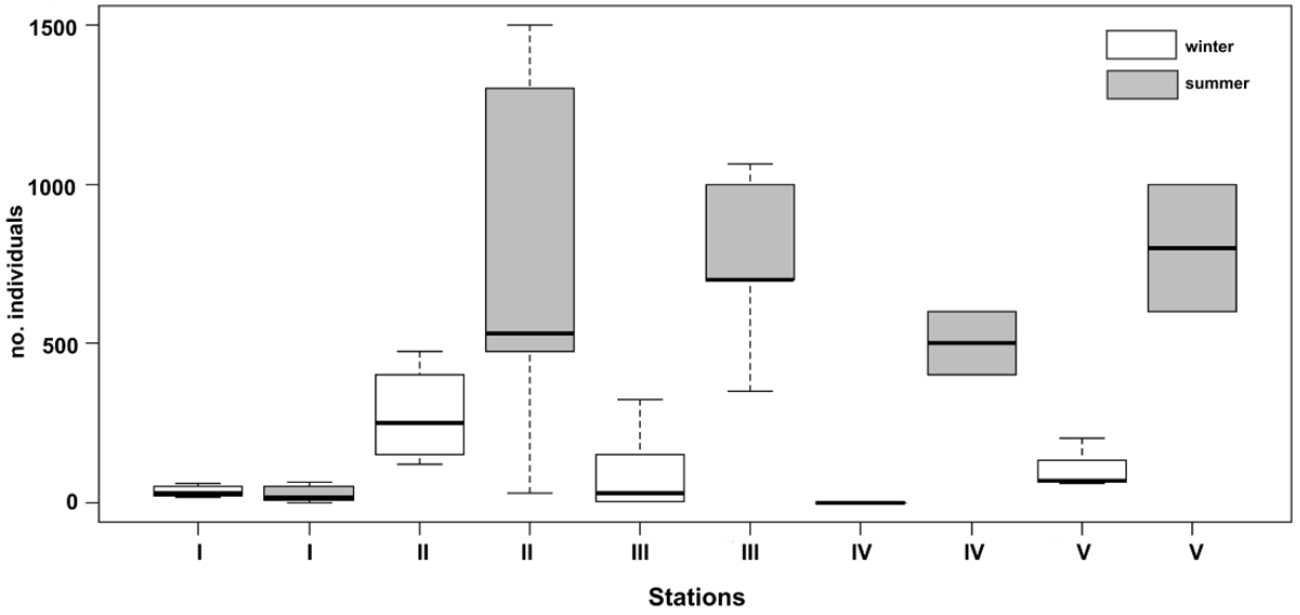
Box-plot of the number of individuals of Drimeotus viehmanni, in the winter and the summer months, in the five stations (I–V) of Peştera cu Apă din Valea Leşului.

For a better understanding of the seasonal behaviour of the studied species, we separated the data recorded in winter from the data recorded during the summer months (Fig. 5). The results show an important difference between the two seasons in all the stations, except station I where more individuals were recorded in the winter months (MW = 101, p = 0.002).

Population size

Estimates of the population size in the Peştera cu Apă din Valea Leşului were obtained from the mark-resight data (Table 1). At station II, from the 328 individuals marked in March 2005, the highest number of recaptured individuals was 12, in May 2005. The re-seen marked individuals decreased from month to month and hereby in June 2005 there were 11 beetles marked from the total of 30 observed beetles. According to these data the estimated population size at station II varied between 5, 084 and 147, 764 (Fig. 6).

Figure 6.

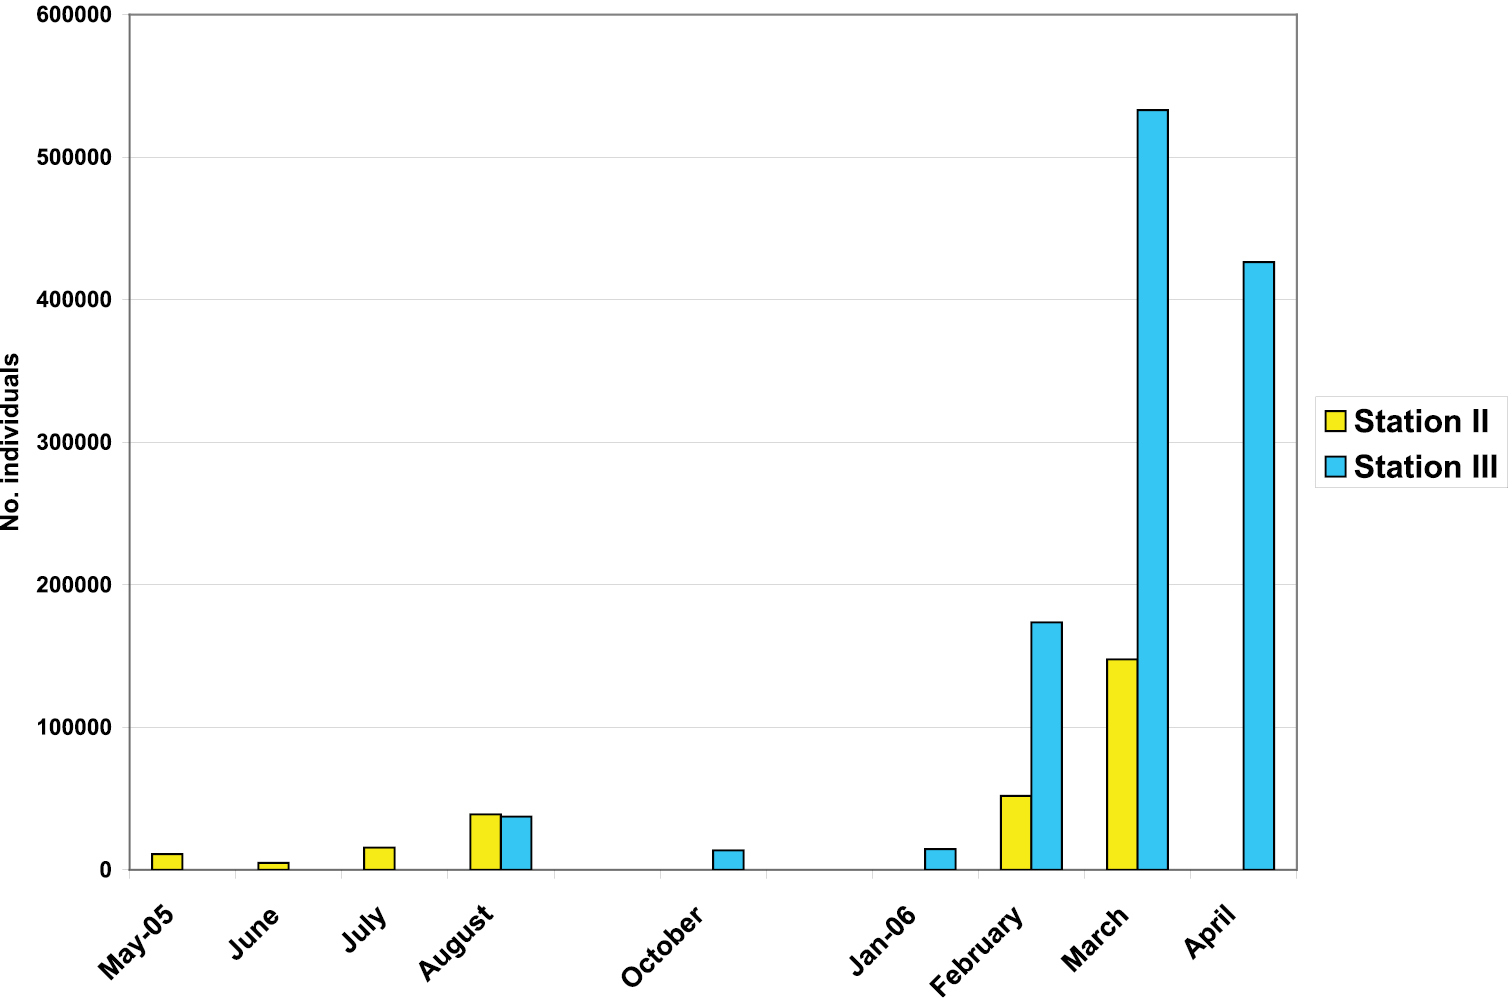
The evolution of the Drimeotus viehmanni abundance in two stations of Peştera cu Apă din Valea Leşului.

At station III, from the 1, 065 marked beetles most individuals were observed in the next month (9 marked individuals). Afterwards, there were just one or two marked beetles at the bait. With the Lincoln-Petersen formula the lowest estimated size of the population at station III was of 13, 845 and the highest was of 533, 033 individuals (Fig. 6).

Only 5 marked beetles were found in a different station (Table 1). One yellow marked individual was observed after one and a half year at station I. A blue marked individual was observed one year and five months later at the same station. A third one (yellow marked) was observed at station III after one year and seven months from the marking. Two individuals marked with blue were observed in station IV after 9 months and after almost 2 years, respectively. The covered distances were 225 m (between stations II and I), 260 m (between stations III and I), 35 m (between stations II and III) and 10 m (between stations III and IV), respectively. In their travel, the yellow marked individuals had to cross the stream between stations II and III (Fig. 7).

Figure 7.

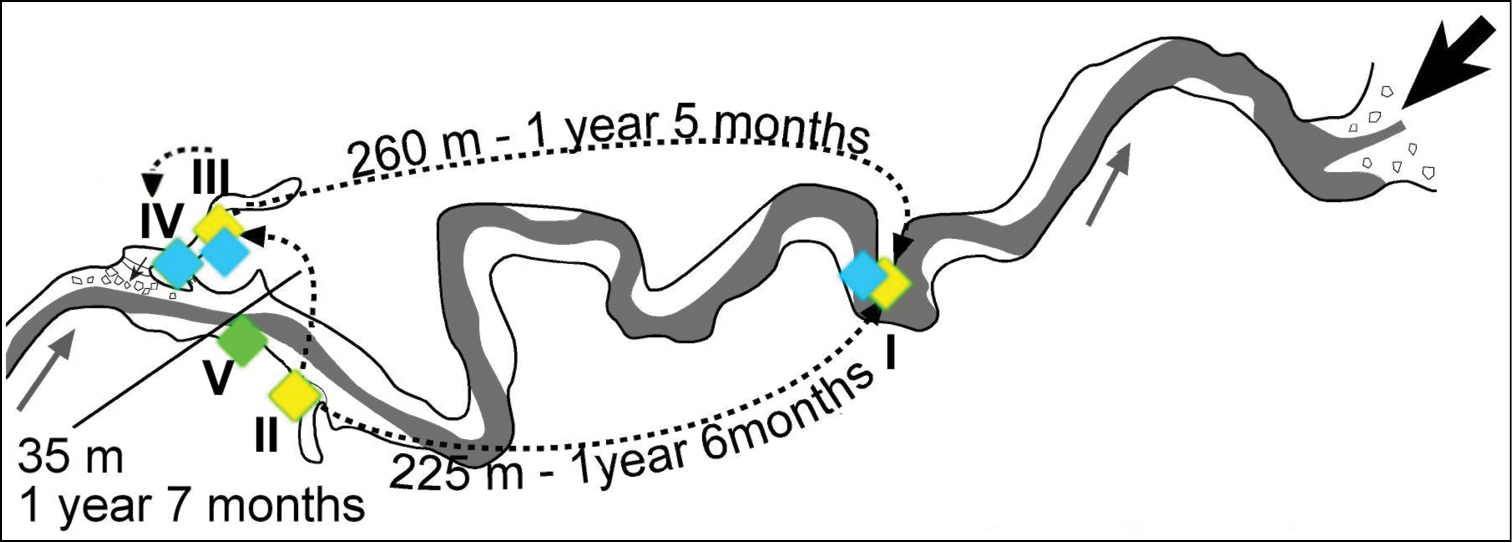
The migration routes of Drimeotus viehmanni inside Peştera cu Apă din Valea Leşului: yellow = mark for individuals at station II, blue = mark for individuals at station III.

Discussion

The temperature in the studied cave oscillated from 8 to 9.4°C, higher than during the period 1972–1974 (Racoviţă and Cocean 1977), when the temperature variations were between 7.6 and 8.4°C. This might suggest a warming of the cave climate with a possible ecological effect on the invertebrate populations from the Peştera cu Apă din Valea Leşului. The warming inside the cave follows the general raise of surface temperature in the last decades, knowing the fact that the mean cave temperature in deep zones is equal to the mean annual temperature at the surface.

The observed number of Drimeotus viehmanni was much higher during our study than during the period 1972–1974. In the previous study, Racoviţă and Şerban (1975) recorded the maximum of 410 individuals in the corresponding station IV, and 150 individuals in the corresponding station V. In our study, the maximum abundances were of 600 individuals at station IV, and of 1100 individuals at station V. At this stage of our research we are not able to provide a reliable explanation for such an increase. It can be due to the total growth of the population of Drimeotus viehmanni in the entire system of Peştera cu Apă din Valea Leşului due to the natural dynamics of the species, or it can be the result of increased migrations from the surface habitats caused by environmental changes in the general context of climate warming. Another possible explanation lies in the changes of the surface, intensively deforested in the last two decades, with a consequent drop of humidity in soil/subsurface habitats.

The fluctuation of the number of individuals presented the same seasonality as in the cases of Pigailh Cave (Delay 1978), Sainte Catherine Cave (Juberthie 1969), Scărişoara Ice Cave (Racovitza 1980) and previous study of the Peştera cu Apă din Valea Leşului (Racoviţă and Şerban 1975). A much higher number of individuals was recorded during the summer months compared to the winter ones. Drimeotus viehmanni is not influenced by temperature and air relative humidity because these parameters showed no significant difference between the two seasons in the same station, as was also suggested by Racovitza (1980). This author also suggested that the reproduction cycle cannot entirely explain the seasonal pattern of abundance. Therefore, we propose here another explanation that is the impact of surface seasons on the migrations between the voids network (including the cave) and the subsurface habitats.Colder months have high precipitation rates thus creating suitable conditions also in subsurface habitats, while during warmer months superficial habitats are drier and populations migrate towards deep habitats. Drimetous is known as a versatile genus and highly mobile in the entire subterranean environment, able to survive in subsurface humid habitats as well as in deep caves, probably preferring superficial habitats in wetter conditions.

The estimated population size presents high variability (between 5, 084 and 147, 764 individuals at station II and between 13, 845 and 533, 033 individuals at station III) inferred from the small number of recaptured beetles. The low resolution of this estimation is similar to that observed for Speonomus and Pholeuon representatives (Cabidoche 1966, Juberthie 1969, Delay 1978, Racovitza 1980). By considering the mean value for the entire cave population, we can estimate an abundance of 122, 464 individuals, with a lower number in station II (45, 135 individuals, similar to the estimation for other populations of Leptodirini; Delay 1978, Racovitza 1980), and higher in station III (199, 794 individuals). The mark-resight method is subjected to high errors and the correct method would be to mark the individuals on every occasion they are counted, but this might be of negative impact on the survival of individuals. There are some assumptions of the simple Lincoln-Petersen mark-recapture (resight) methods: (1) the subset of selected population is representative of the entire population in terms of sighting probabilities; this is the fundamental assumption of the mark-resight method (McClintock 2013). It is impossible to know the population distribution in the entire subterranean system and to be sure that the estimation of the population size is due only to the cave population or it is also the contribution of other populations that live in the system. Given the high number we obtained it probably reflects the size of the entire population at the level of the entire system. It must be also emphasized that Peştera cu Apă din Valea Leşului is a special case among Romanian caves for the extremely abundant population inside the cave; (2) the population is close to addition and deletion; (3) marks are not lost or overlooked; (4) there are equal chances of “catchability” of animals. We assume that the number of births equals the number of deaths in this population. The finding of marked individuals 2 years after the marking can be the proof of a lasting paint and of survival of the individuals.

The metapopulation concept provides explanations for how species can survive in fragmented landscapes, such as subterranean habitats (Moldovan et al. 2012). Movement of individuals between spatially separated populations ensures the survival of the entire metapopulation and re-colonisation of the patches where local populations have gone extinct (Hanski and Gilpin 1997, Hanski 2001). Animal movement and the factors that can affect it must be considered for the conservation of highly fragmented populations and management of show caves. The number of migrants between habitat patches is expected to decrease with increasing patch isolation because of the dilution effect associated with the spread of individuals in space (Ims 1995), the mortality of individuals in time (Hanski 1999) and the limited dispersal ability of the beetles (Baur et al. 2005). The obtained results suggest that the beetles from the Peştera cu Apă din Valea Leşului moved between neighbouring patches on a distance of 10 m over the same amount of time as on distances longer than 200 m. The subterranean stream was not a barrier for beetles and proves the connection between cave sub-populations of Drimeotus viehmanni. Individuals of this species are able to cover large areas in long periods of time. The season of dispersal is in winter and migration of the few cave beetles indicates a behaviour which is not continuous but triggered by environmental features and involves only a negligible part of the population.

Although dispersal is critical for the population persistence, particularly for small populations (Den Boer 1979) and in fragmented habitats (Tilman et al. 1994, 1997, Hanski 1999), it seems that cave beetle populations are stenotopic if there are no environmental constraints. If they find a proper place with more or less continuous input of nutrients, migrations are occasional. The differences between patches in a heterogeneous system such as the subterranean environment could be explained by differences in habitat quality, by presence/absence of other species, and by patch size. In the case of the studied population of Drimeotus viehmanni, whith individuals that are always concentrated in few sectors of the cave, the differences can be given by the points of nutrients input. The patches where this cave species is extremely numerous are near natural narrow pits with contact with the surface (station III), where diffuse flow of water from the surface brings food underground.

Data on dispersal of subterranean beetles are rare, despite the theoretical and practical importance for the conservation of these highly endemic taxa. Knowledge of the movement rules can predict the dispersal capacity and patchwise migration rates in complex landscapes (Baur et al. 2005), such as subterranean environments. At local scales, the lack of migration of subterranean populations would isolate some of them and processes of speciation would occur. However, such processes are known to occur only at higher spatial levels of the subterranean heterogeneous environment. Subterranean populations can persist only if the dispersal rate is sufficient to maintain genetic variability against random genetic drift (Baur et al. 2005). Genetic markers may confirm the described pattern for cave beetles and further researches should concentrate on such studies.

Acknowledgements

We thank to Fejér Anna, Milik Csongor and Popa Flaviu for the field assistance. The suggestions of Mauro Rampini and Valerio Sbordoni improved the quality of the manuscript. OTM was supported by the Romanian Academy.

References
Bailey NTJ (1951) On estimating the size of mobile populations from recapture data. Biometricka 38: 293-306.
Bailey NTJ (1952) Improvements in the interpretation of recapture data. Journal of Animal Ecology 21: 120-27. doi: 10.2307/1913
Baur B, Coray A, Minoretti N, Zschokke S (2005) Dispersal of the endangered flightless beetle Dorcadion fuliginator (Coleoptera: Cerambycidae) in spatially realistic landscapes. Biological Conservation 124: 49-61. doi: 10.1016/j.biocon.2004.12.011
Bernardini C, Di Russo C, Rampini M, Cersaroni D, Sbordoni V (1996) A recent colonization of Dolichopoda cave crickets in the Poscola cave (Orthoptera, Rhaphidophoridae). International Journal of Speleology 25: 15-31. doi: 10.5038/1827-806X.25.1.2
Cabidoche M (1966) Contribution à la connaisance de l’écologie des Trechinae cavernicoles pyrénéens. Thèse Faculté des Sciences Paris, 228 pp.
Carchini G, Rampini M, Sbordoni V (1982) Congruence between mark-recapture and plot density estimates. International Journal of Speleology 12: 29-36. doi: 10.5038/1827-806X.12.1.3
Carchini G, Rampini M, Sbordoni V (1994) Life cycle and population ecology of the cave cricket Dolichopoda geniculata (Costa) from Valmarino cave (Central Italy). International Journal of Speleology 23: 203-218. doi: 10.5038/1827-806X.23.3.6
Cocean P (1995) Peşterile României, Editura Dacia.
Cooper JE, Cooper MR (2009) Long-term mark-recapture studies of population sizes in the stygobiotic crayfishes (Decapoda: Cambaridae) of Shelta Cave, Alabama, USA. Subterranean Biology 7: 35-40.
Crandall KA, Posada D, Vasco D (1999) Effective population sizes: missing measures and missing concepts. Animal Conservation 2: 317-319. doi: 10.1111/j.1469-1795.1999.tb00078.x
Culver DC, Holsinger JR (1992) How many species of troglobites are there? National Speleological Society Bulletin 54: 79–80.
Delay B (1978) Milieu souterrain et écophysiologie de la reproduction et du developpement des coléoptères Bathysciinae hypogés. Mémoires de Biospeologie 5: 1-349.
Deleurance-Glaçon S (1963) Recherches sur les coléoptères troglobies de la sous-famille de Bathysciinae. Annales des Sciences Naturelles, Zoologie 5: 1-172.
Den Boer PJ (1979) The significance of dispersal power for the survival of species, with special reference to the carabid beetles in a cultivated countryside. Fortschrifte der Zoologie, 25: 79–94.
Freckleton RP, Watkinson AR, Green RE, Sutherland WJ (2006) Census error and the detection of density dependence. Journal of Animal Ecology 75: 837-851. doi: 10.1111/j.1365-2656.2006.01121.x
Hanski I (1999) Metapopulation Ecology. Oxford University Press, Oxford.
Hanski IA (2001) Population dynamic consequences of dispersal in local populations and in metapopulations. Pp. 283–298 in Clobert J, Danchin E, Dhondt AA, Nichols JD (Eds) Dispersal, Oxford University Press, Oxford.
Hanski I, Gilpin ME (1997) Metapopulation Biology. Academic Press, London.
Hobbs HH III (1978) Studies of the cave crayfish, Orconectes inermis inermis Cope (Decapoda, Cambaridae). Part IV: Mark-recapture procedures for estimating population size and movements of individuals. International Journal of Speleology, 10: 303-322. doi: 10.5038/1827-806X.10.3.7
Hobbs HH III (1981) Investigations of the troglobitic crayfish Orconectes inermis testii (Hay) in Mayfield’s Cave, Monroe County, Indiana. International Journal of Speleology 11: 21–32. doi: 10.5038/1827-806X.11.1.4
Hovestadt T, Nowicki P (2008) Process and measurement errors of population size: their mutual effects on precision and bias of estimates for demographic parameters. Biodiversity and Conservation 14: 3417-3429. doi: 10.1007/s10531-008-9426-0
Ims RA (1995) Movement patterns related to spatial structures. Pp. 85–109 In Hansson L, Fahrig L, Merriam G (Eds) Mosaic Landscapes and Ecological Processes, Chapman and Hall, London. doi: 10.1007/978-94-011-0717-4_4
Juberthie C (1969) Rélations entre le climat, le microclimat et les Aphaenops cerberus dans la grotte Saint Catherine (Ariége). Annales de Spéléologie 24: 75-104.
Keith JH (1975) Seasonal changes in a population of Pseudanopthalmus tenuis (Coleoptera, Carabidae) in Murray Spring Cave, Indiana: a preliminary report. International Journal of Speleology 7: 33-44. doi: 10.5038/1827-806X.7.1.4
Knapp SM, Fong DW (1999) Estimates of Population Size of Stygobromus emarginatus (Amphipoda: Crangonyctidae) in a Headwater Stream in Organ Cave, West Virginia. Journal of Cave and Karst Studies 61: 3-6.
McClintock BT, White GC (2009) A less field-intensive robust design for estimating demographic parameters with mark–resight data. Ecology 90: 313-320. doi: 10.1890/08-0973.1
McClintock BT (2013) Mark-resight models. Pp. 343–360 in. Cooch EG, White GC (Eds) Program MARK - gentle introduction, 13th edition, http://www.phidot.org/software/mark/docs/book/
Moldovan O (2000) Révision de Drimeotus s.s. Miller, 1856 (Coleoptera, Cholevidae, Leptodirinae) de Transylvanie (Roumanie) avec description de deux nouvelles espèces et clé de détermination des taxa. Zoosystema 22: 139-152.
Moldovan OT, Meleg IN, Persoiu A (2012) Habitat fragmentation and its effects on groundwater populations. Ecohydrology 5: 445-452. doi: 10.1002/eco.237
Peck SB (1975) A population study of the cave beetle Ptomaphagus loedingi (Coleoptera; Leiodidae; Catopinae). International Journal of Speleology 7: 19-32. doi: 10.5038/1827-806X.7.1.3
R Development Core Team (2007) R: a language and environment for statistical computing Vers. 2.5.0. R. Foundation for Statistical Computing, Vienna.
Racoviţă G, Cocean P (1977) Recherches climatologiques dans la Grotte de Valea Leşului. Travaux de institut de Speologie „Emil Racoviţă” 16: 183-201.
Racoviţă G, Şerban M (1975) Recherches sur la biologie de la population de coléoptères cavernicoles de la Peştera cu apă din Valea Leşului. Annales de Spéléologie, 30 : 351–363.
Racovitza G (1980) Étude écologique sur les coléoptères Bathysciinae cavernicoles. Mémoire de Biospéologie 6: 1-199.
Rusdea E (1992) Stabilisierende Selektion bei mikrophthalmen Höhlentieren: Untersuchungen zur tageszeitlichen Aktivitätsverteilung und Populationsdynamik von Laemostenus schreibersi Küster (Carabidae). Mémoires de Biospéologie 19: 1-110.
Venarsky MP, Huryn AD, Benstead JP (2012) Re-examining extreme longevity of the cave crayfish Orconectes australis using new mark–recapture data: a lesson on the limitations of iterative size-at-age models. Freshwater Biology 57: 1471-1481. doi: 10.1111/j.1365-2427.2012.02812.x
Simon KS (1997) Effects of organic pollution on an Appalachian cave: changes in macroinvertebrate populations and food supplies. American Midland Naturalist 138: 387-401. doi: 10.2307/2426830
Tercafs R, Brouwir C (1991) Population size of Pyrenean troglobiont coleopters (Speonomus species) in a cave in Belgium. International Journal of Speleology 20: 23-35. doi: 10.5038/1827-806X.20.1.3
Tilman D, Lehman CL, Yin C (1997) Habitat destruction, dispersal, and deterministic extinction in competitive communities. American Naturalist 149: 407-435. doi: 10.1086/285998
Tilman D, May RM, Lehman CL, Nowak MA (1994) Habitat destruction and the extinction debt. Nature 371: 65-66. doi: 10.1038/371065a0
Turchin P (2003) Complex population dynamics. Princeton University Press, Princeton NJ.
Willemart RH, Gnaspini P (2004) Spatial distribution, mobility, gregariousness, and defensive behavior in a Brazilian cave harvestman Goniosoma albiscriptum (Arachnida, Opiliones, Laniatores). Animal Biology 54: 221–235. doi 10.1163/1570756042484674